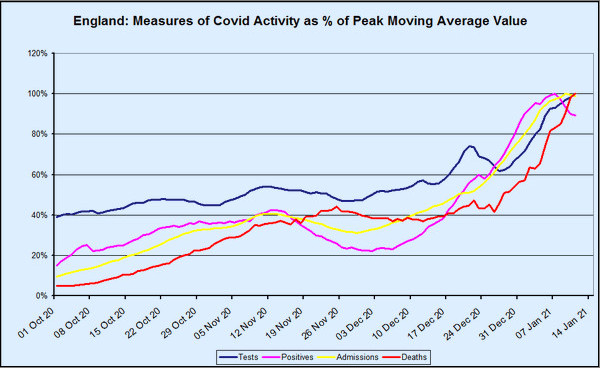
One of the features of this winter’s covid–19 wave that has perplexed Dr No, and indeed many others, is the lack of the normal lag between rises in positive tests, admissions and deaths. In the normal course of events — and as we are so often told by political and media experts — admissions lag behind cases, and deaths lag behind admissions. Yet when we look at the chart above, which presents various measures for England — the methodology will be explained shortly — the lags are rather conspicuous by their absence. From around about Christmas Day onwards, tests, positives and admissions have been in lockstep, while deaths have shown a lag, but only a short one, of about seven days. The peaks in both positives and admissions — both are currently in decline — are only two days apart. None of this makes any sense at all.
Articles Written By: dr-no
Through a Glass, Lightly
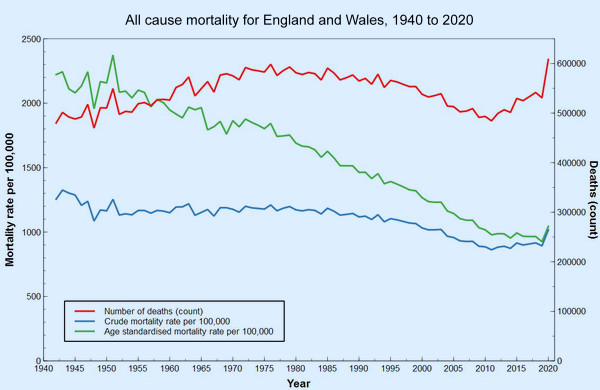
And though I have the gift of prophecy, and understand all mysteries, and all knowledge; and though I have all faith, so that I could remove mountains, and have not perspective, I am nothing… With all due apologies to one of the finest bits of English prose ever written, the major problem facing anyone foolish enough to attempt to put the 2020 covid epidemic in perspective is lack of perspective. Our dear ONS diligently collect more than enough data to fill the storehouse of the mind, but all too often it is ad hoc, or presented through shifting frames of reference. The result is that almost all attempts to put covid in perspective use a very short time frame, typically five of ten years. This is, Dr No suggests, short-sighted, rather like trying to assess the Victorian era by looking at the last few years of Queen Victoria’s reign. Given that the last decade or so have seen historically low crude and age standardised mortality, 2020, with its excess deaths caused by covid, tends to look pretty dreadful, because we are comparing 2020 with the best years on record.
Early Assessment of 2020 Mortality
If there is one thing guaranteed to make Dr No’s breakfast porridge go down the wrong way, it is the sound of Martha Kearney on the Today programme playing her voice as if it was an electric slide guitar. That, and the little pauses after the interviewee stops speaking, and Ms K asks her next question, as she waits for her controller to finish telling her what non-sequitur of a question to ask next. Mercifully, we were spared Ms K’s slide guitar treatment of the 2020 excess deaths data released yesterday, but elsewhere there was plenty of wailing to be had. “More deaths in England and Wales in 2020 ‘than any year since 1918’” wailed yahoo, while Sky News went with “an almost unparalleled loss of life” above some rather lurid blood red background charts of eye-popping variety. In a related twitter thread, Mr Conway sagely pronounced that “there is no definitive measure for the scale of this pandemic. There are other prisms beyond even these…”. Indeed there are. The prism glaringly obvious by its absence is age standardised mortality rates.
Email Subscriptions
A reader very kindly let Dr No know that the email subscription form (“Subscribe to Dr No” form on the right) was broken. There have also been some odd random ‘unsubscribe’ events for subscribers where Dr No knows the subscriber didn’t unsubscribe (because the subscriber was a test email address used by Dr No!). Dr No has therefore migrated all subscribers across to a new system which appears to be working (though you never can tell 100% with these things).
Lies Damned Lies and the FT
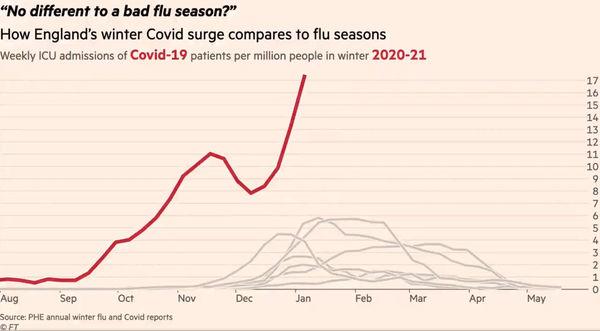
This image shows the climax of one of two animated charts produced by the FT’s data journalist. Currently doing the rounds on twitter, it purports to show the strain on, and so by implication the imminent collapse of, the NHS. It matters, not least because it has been viewed for getting on for 2 million times, and so is likely to have had something of an impact on the current political, media and public perception of where we are with covid. At first glance, it is alarming. But is it a fair representation of the facts? Dr No is pretty sure it is not, though proving that is easier said than done. Nonetheless, nothing ventured, nothing gained, so what can be found out about this chart?
Hot Stuff Bias and Diagnostic Drift
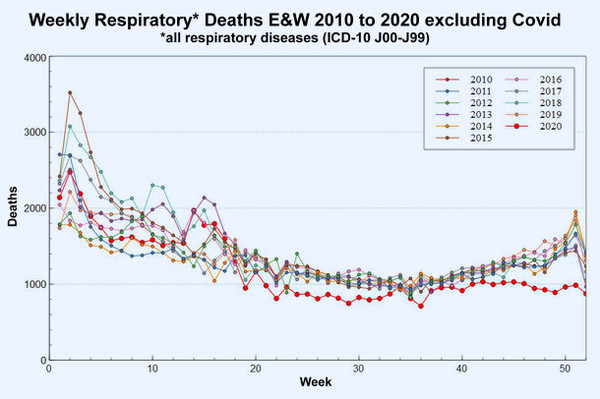
One of the problems caused by a disease going hot is hot stuff bias. This is simply human nature at work. If everyone is talking about covid, then every respiratory patient starts to look like a covid patient. Add in a covid test that is so sensitive it can detect viral dandruff left behind from past infections, and the conditions are right for a form of diagnostic drift, which happens when a diagnosis accumulates patients that don’t properly belong to it. Is there any evidence this might be happening with covid?
Situation Still Mostly Normal — Week 5
NHS England released its weekly bed occupancy figures for week 5, 28th December 2020 to 3rd January 2021, this morning, and Dr No has given them the same treatment that he gave weeks 3 and 4. The headline is overall occupancy is still lower than it was in the corresponding week in either 2018/19 or 2019/20, but there are within the overall picture some clear hot spots, notably in London. The heat map colours are the same: red means occupancy is 95% or higher, amber means occupancy is between 90 and 95%, and green means occupancy is 90% or less. As in previous weeks, the images in the post are simple visual indicators — the more red, the hotter things are, the more green, the less hot things are, with links to larger pdf versions in the captions. Week 3, rather than week 4, which includes Christmas Day and Boxing Day when activity is lower, images are provided for comparison.
The Loneliness of the Long Distance Shedder
For some time, Dr No has been bothered by the fact that some people with covid continue to have positive PCR tests long after they can be considered ill and infectious. These people, the long distance shedders, will, because of the way cases are defined and counted, appear as cases, even when clearly they are not cases. They will themselves suffer the loneliness of imposed but pointless self-isolation, but they will also inflate the apparent size of any covid wave, and in so doing aggravate alarm and panic, despite the fact that aggravation is unfounded, because they are not cases, nor are they infectious. In short, every covid wave is inflated, and the question for today is: by how much does the way we count covid cases inflate our estimate of the number of true cases?
Covid Death Inflation
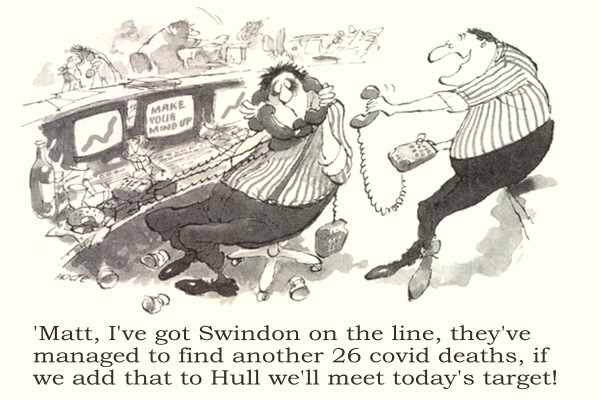
Is the number of covid deaths inflated? Almost certainly, yes. Does this matter? Of course it does. Apart from being an affront to science, it creates and perpetuates a disproportionate sense of fear about covid, and that in turns drives pathological responses to covid, from national lockdowns to individual hysteria. ‘The bigger the fear,’ observed one of the diarists in the recent compelling BBC history series Berlin 1945, ‘the more ridiculous the excuse.’ It is the fear that puts the pop in the fuel of the Milk Curdler’s blow lamp, it is the fear that powers Dylan’s Idiot Wind, blowing through the flowers on your tomb, the curtains in your room, from the Grand Coulee Dam to the Capitol.
Situation Still Normal
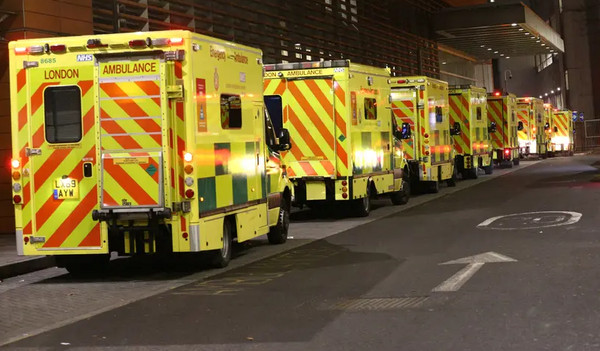
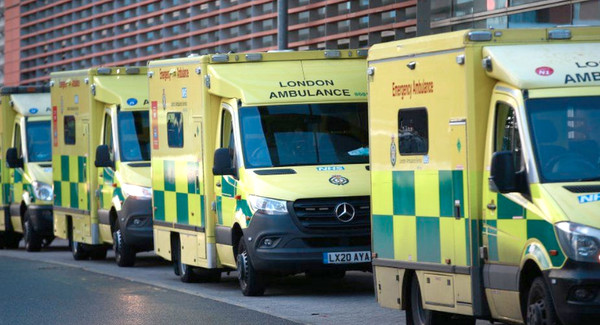
Much is being made in the main stream media of the pressures on the NHS, which is reported to be overwhelmed, or at least about to be overwhelmed. Grim images of ambulances stacked line the front pages, though this one, from the BBC two days ago, seems to have caught the moment when no one was at home. Dr No has lightened the image just a bit, the better to see inside the cabs, and all he can see is empty seats and head rests. Squads of medics and paramedics are on standby, ready to be interviewed on the detail in their corner of the NHS, and provide alarming predictions of imminent implosion. All this fits well with the Establishment/MSM mantra, that Coronageddon is just around the corner, but is it true? Is the NHS really about to implode?