
When the Facts Change
When the facts change, we’re supposed to change our minds, but what do we do when the facts don’t make any sense? If we followed the doctrine often attributed to John Maynard Keynes, we should probably stop making any sense, and go mad. Such thoughts occurred to Dr No as he contemplated another silent but deadly dataset released by ONS a couple of weeks ago. It extends the previous release of covid deaths by vaccination status, which ran from January this year to early July, to late September, and so covers a period of considerable interest. Just as before, the published report only covers covid deaths1, and needless to say, the vaccines are shown to be wonderfully effective. Tractor production continues to rise. But, again just as before, buried in the underlying dataset are the weekly numbers for all cause mortality. All cause mortality, as readers familiar with these things will know, is normally the most unadulterated mortality data there is, unfogged by distractions about diagnostic fudgery. A stiff is a stiff is a stiff, the whole stiff, and nothing but the stiff. What all cause mortality lacks in detail, it gains in robustness.
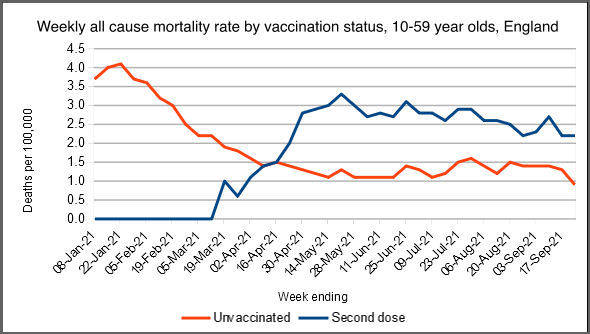
How curious then that plots of this data don’t, on a number of points, make any sense. The chart at the top of this post shows the weekly mortality rate per 100,000 persons at risk for 10 to 59 year olds for England, for the unvaccinated and the fully vaccinated (marked ‘Second dose’). The orange/red unvaccinated line sort of makes sense, winter excess mortality falls away as spring and the summer arrive, but what on earth is going with the fully vaccinated? The 10 to 59 year old band (ONS’s choice) is a heterogeneous band, with older members being mostly fully vaccinated by late May, and younger members straggling along behind, to reach at least half fully vaccinated by late September. What happens to the mortality rate in this fully vaccinated group? It starts to rise in mid March, overtakes the unvaccinated rate in mid April, and then levels off at about double the unvaccinated rate in mid May, and then stays there.
This makes no sense, especially in the later stages. The early rise in mortality in the vaccinated could be explained by preferentially vaccinating those at higher risk, and so more likely to die, in the early stages, but once large numbers (getting on for tens of millions) of people at normal risk are vaccinated, any such effect will disappear. Bear in mind the rates are all cause mortality — no need to fuss about cause of death — and the numbers are charted as rates, so accounting for the changes in numbers in each group. According to this chart, based on ONS data, for 10 to 59 years olds, being fully vaccinated roughly doubles your chance of dying. No wonder this didn’t make it into the published ONS report, let alone the mainstream media.
What happened in the older age bands, the 60 to 69 year olds, the 70 to 79 year olds and those aged 80 and over (again, these are ONS’s choice of age bands)? The charts are shown below. Again, Dr No has only included the unvaccinated and the fully vaccinated, because the partially vaccinated are all over the place, and including them makes it look as though Montezuma is back in town. Note that sometimes stratified tables and charts are superior to summary statistics like ASMRs based on stratified data, because they allow us to see what is happening in each strata, a level of detail which gets lost in summary statistics.
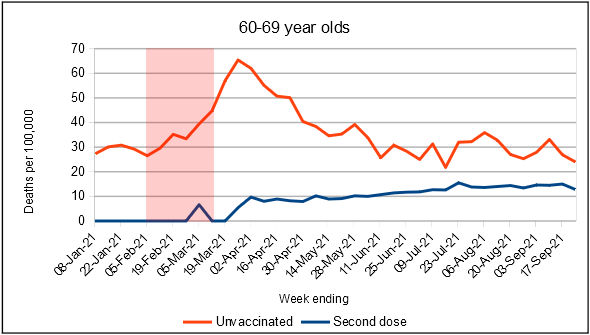
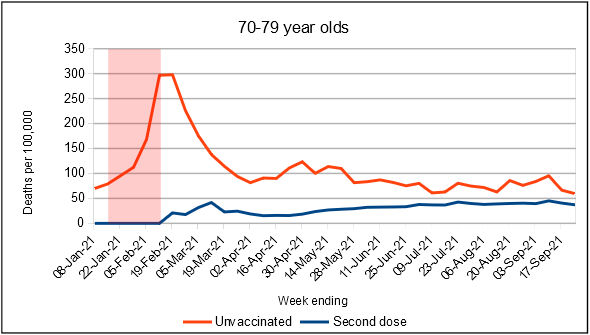
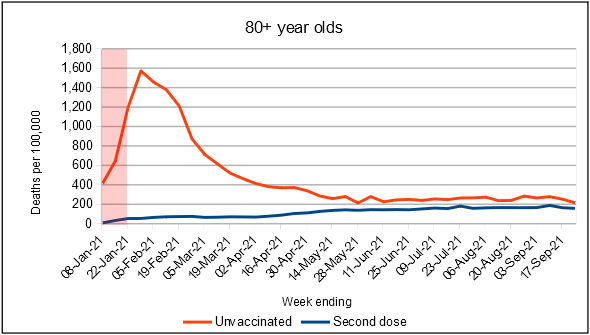
Figures 1-3: weekly all cause mortality in England by vaccination status for 60-69 years olds (top), 70-79 years olds (middle) and those aged 80 and over (bottom). The red shaded boxes cover the period when the age band received most of it’s first dose of vaccine, rising from around 20% coverage to around 80% coverage, determined by eyeballing the vaccine coverage charts in these reports. Note the Y axes are not to the same scale, there being more deaths as age increases
The most striking thing, visible in all three age bands, is the very sharp rise in unvaccinated mortality shortly after the age band had most of its members receive their first dose of vaccine. The older the age band, the earlier the first dose, the earlier the peak. Dr No is baffled: there is no obvious explanation. Last winter’s wave of excess mortality may have contributed to some of the over 80s deaths, but it peaked in early January, and had dissipated by late March/early April, when the 60 year olds were hardest hit. There is no obvious explanation. Perhaps the threat of imminent vaccination among those who have decided against vaccination sends a chill through the heart, and the poor dears keel over? A nocebo effect that somehow manages to operate at a distance?
The right hand halves of the charts are rather more stable, and perhaps credible. The broad pattern is the same in all three charts: a rise in mortality in the vaccinated, and a slight decline or levelling off of mortality in the unvaccinated. The overall effect is the all cause mortality rates in the vaccinated and unvaccinated are converging. Although past vaccine performance may not predict future performance, in appears at least plausible that before too long, being vaccinated, or not vaccinated, won’t make a jot of difference in those aged 60 and over. Bear in mind these are ONS figures, un-doctored by Dr No; the charts are plots of unadulterated ONS data.
Un-doctored by Dr No, definitely, but what about by ONS, perhaps by omission rather than commission? As with the earlier deaths by vaccination status dataset, this dataset is far from complete. Various spot checks show reveal undercounts, both for death counts and population at risk (numbers vaccinated/not vaccinated). For example, this data records 4,080 deaths in those aged 80 and over for week 38 (week ending 24th Sepember), while ONS’s weekly deaths report records 5,625 deaths for the same group in the same week, albeit for England and Wales, rather than just England. Likewise, for the same week, the number of 80 and over year olds shown as fully vaccinated in this data set is 2,439,328, compared to 2,675,031 in the daily vaccination reports. But these dropouts do not necessarily cause major distortions, given that both numerator and denominator are both low, meaning rates are perhaps relatively unaffected. That is surmise, but not beyond the realms of possibility.
What conclusions can be drawn? First, we should note with regret the incompleteness of ONS’s deaths by vaccination status data, even if in practice it may not have caused major distortions in the rates. Second, we have to admit we have no idea what caused Apocalypse Now to march to the tune of the Ride of the Valkyries through the unvaccinated in the older age bands in the first few months of the year: it makes no sense. But perhaps we can salvage something from the second half of the data, a period of relative stability, despite what the MSM would have you believe, for both vaccination rates and all cause deaths.
Recall that we are looking at all cause mortality, data which is uncontaminated by distractions over whether this was or wasn’t a covid — or cardiac, or neurological, or whatever — death, and on one level, whether you are dead or alive, rather than what caused your death, is all that matters. Viewed through this harsh but singular lens, ONS’s own data tell us that, for working age people, being vaccinated appears to increase your overall risk of death. Sure, the numbers are small (in the hundreds), but that is of no comfort if you are one of the unlucky ones, and furthermore, it is hundreds week in week out, and they soon add up. For older age groups, being vaccinated may offer some protection, but that protection appears to wane over time, and decrease with increasing age. There is certainly nothing in this unique set of official data to suggest that vaccines do much good, and something to suggest they may well do harm, and to the extent that this is true, the entire Fourth Reich of mandatory vaccination and covid certification is an evil empire built on a falsehood.
1. (Added 11:40 17th Nov 2021) Dr No has noticed the ONS report does mention all cause mortality, but only in passing, and it is fair to say the title and thrust of the report focuses on covid mortality.
A thought: contrary to popular opinion, vaccination does not bring immortality, so is it possible that what we are seeing is a transfer of deaths from the unvaccinated group to the vaccinated group, that is if the vaccines are preventing deaths from CoVid, is it just ‘saving’ the individuals to be carried off by something other than CoVid?
And is it not generally accepted that vaccination weakens immune response for a while afterwards, so vaccinated people are more susceptible to opportunistic infection?
Well, well, well…
An interesting read Dr No — and just as Israel decides to vaccinate over 5 year olds.
And Austria introduces medical apartheid by locking down the unvaccinated.
The world has gone mad!
People need to wake up.
The charts suggest that vaccinating people somehow kills some of the unvaccinated. That’s what the pink bands imply. Lots of vaccinations: red curve rises. Main vaccinations period over: red curve falls.
A reasonable hypothesis is that getting vaccinated makes you more infectious for a few weeks. Then either (i) the effect wanes, or (ii) the most vulnerable among the unvaccinated having been bumped off, their curve falls, or (iii) both. Or even (iv) the causes of death are nowt to do with Covid. I’d guess that (iv) is not awfully likely to be right.
In which case, vaccination is rather a double-edged sword. Is “get vaccinated and kill your neighbour” a good sales spiel?
Call me a cynic, doc, but you’ve seen this explanation too but would prefer to see it put forth by someone who isn’t risking his right to practise. Very wise too. It’s better that you stay in the game.
Then a vaccine mandate means that the government says “We insist that you take the vaccine and kill your unvaccinated neighbour. That’ll serve the deplorable fellow right.”
Now, suppose further that after, say, six, seven, or eight months the vaccinated become again largely unprotected. So they’re told to take a booster. Now they will presumably be having a second go at killing their neighbours including the already vaccinated neighbours who have decided not to take the booster. This cycle could continue indefinitely with the red line still eventually hovering above the blue line thus “proving” that the vaccine saves lives.
Not surprising at all. Take your first figure, the composition of the vaccinated and unvaccinated groups are changing with respect to their age profile. Think about the 10-59 group. At all times the vaccinated group with be older age groups with higher all cause mortality (or with severe underlying comorbidities). Consequently as vaccination proceeds during the year the unvaccinated group average age will be shifting downwards and so will the all cause mortality. By September, the unvaccinated group will contain predominantly those between 10 and 18 years old. A group with an intrisically low all cause mortality (along with 10% or so from older groups who have refused vaccination).
Dearieme has a believable theory – the recently jabbed are infecting the unsullied.
The virus and the mRNA gloop are turning out to be very clever concoctions!
I posted before about the strange effect of being near the jabbed (mainly indoors) – a cold-like condition results for 2 – 3 days after these ‘shared air’ events, which could be due to shedding.
I also note the lack of aspiration (which checks the jab is IM, not IV), by the semi-trained operatives, is now becoming a more widely known concern. Dumping the gloop IV may well be the trigger for some of the worse reactions and deaths.
Nigel C – yes, the composition of vaccinated and vaccinated does change during the period, here’s the relevant chart from the most recent UKHSA Vaccine Surveillance Report, to week 44:
There is rapid change in the middle, say weeks 15 to 30, and yes, the average age of the unvaccinated 10-59 age group will get lower, and so yes, all cause mortality should decline, but it doesn’t, it remains pretty constant from around week 15.
The early steep rise in mortality in the vaccinated 10-59 group could be explained by the early vaccination of those more at risk (clinically, or through age) but again there is no obvious reason why its mortality rate, like the unvaccinated, stabilises during the period of maximum change of age composition. Here’s the chart with a red box overlay for the period of maximum change, eyeballed from the above chart (far looser than the older age groups, covering from about 10% uptake to something over 50%):
During this period, the average age and fitness of the vaccinated 10-59 year old group also comes down, as more progressively younger fitter people move from the unvaccinated group to the vaccinated group, and so the mortality rate should decline. OK, it does a bit, but not by very much, given the 10-59 vaccinated group changes from mostly older and/or vulnerable people to having many more middle aged and then younger, fitter people.
No doubt changing age compositions has a lot to do with it, but Dr No remains baffled by the relatively straight lines on the middle to right hand side of the chart despite the rapidly changing age structures.
It may be that missing data is part or even all of the explanation, but until such time as ONS tighten up their data collection, there is not much that we can do about that.
Assuming the vaccinated awaiting a second dose are included in the unvaccinated category does that mean it’s the second dose that’s deadly? Looks like the unvaccinated category is a bit too broad to drawn any conclusions from if it includes no dose and one dose.
Terry R – the unvaccinated are the no dose group. Dr No left out the partially vaccinated (1 dose) groups because they are somewhat all over the place, and confuse the picture. The charts compare those who have never had a vaccine with those who have had two doses.
A very simple explanation would be, that people who die within two weeks of vaccination, are counted as “unvaccinated”. If quite a large number die from the vaccine within two weeks of receiving it, but are counted as “unvaccinated”, we would see this graph.
Have you seen Prof Norman Fenton’s interesting hypothesis that it’s simply the delayed reporting of deaths which creates the illusion of mortality benefit for the vaccinated via overestimating the size of the vaccinated denominator compared to the unvaccinated denominator at any time point?
http://probabilityandlaw.blogspot.com/2021/11/is-vaccine-efficacy-statistical-illusion.html
Thank you, Peter. So by the fiat of a Big Brother somewhere the simple English word “unvaccinated” doesn’t mean unvaccinated but rather ‘vaccinated but covering up the embarrassing bit’.
When accountants pull that sort of stunt they are expected to admit to it frequently. I suppose that government medical advisors are free of such a need for transparency.
Your explanation sounds pretty plausible to me. How to distinguish it from my explanation? All we need are figures for the genuinely unvaccinated and for the people in the fortnight after their second jab.
It’s a big deal: does the jab kill you or kill your neighbour?
Tell me, anyone, why haven’t animal tests been done that might shed light on this sort of thing? One can do proper controlled trials on animals.
Why do care workers, nurses (and doctors?) refuse the jab? Do they suspect that the jab has been killing some of the vaccinated?
Sorry if I’m being too chatty this evening, doc, but: I’ve just conjectured that perhaps the vaccines kill some of the people to whom they are administered. That doesn’t distinguish between (i) the vaccines themselves acting like toxins, and (ii) the vaccines making the vaccinated temporarily more vulnerable to death by infection (infection by the Wuhan virus or indeed some other virus).
I suppose animal trials could shed light on that too. Would the original vaccine trials on humans – if they were honest and competent – rule out (i) or (ii)? Or were the samples of people used in the trials too unrepresentative of the general population to be of much help? Or, indeed, were the numbers of subjects used just too small?
Would the spike in unvaccinated deaths following the peak vaccination of that age group ( shaded red area) possibly be related to the fact that one is only considered vaccinated two weeks after the jab.
ie they could be post jab deaths
Peter (and others) – misclassification (of partially vaccinated as unvaccinated) this is certainly a possible explanation, but probably isn’t. There have been occasions when those in the early stages of vaccination have been counted as unvaccinated, not entirely unreasonable from an infection point of view, because the vaccine doesn’t work immediately, but very unreasonable from a side effect (including death) point of view, which can happen at any time. Nonetheless, this type of misclassification shouldn’t apply to ONS’s data, even if ONS’s definitions of vaccine status have always been a bit muddled. The stated definitions in the dataset definitions sheet are:
Vaccination status is determined on the date of death occurrence if a death has occurred, and on the last day of each week if not. Possible values are:
unvaccinated
vaccinated with 1 dose only, date of death/last day of week is less than 21 days after vaccination
vaccinated with 1 dose only, date of death/last day of week is at least 21 days after vaccination
vaccinated with 2 doses, date of death/last day of week is less than 21 days after second vaccination
vaccinated with 2 doses, date of death/last day of week is at least 21 days after second vaccination
which seems clear enough, only the actual data is in four rather than five groups, with (presumably) the last two categories added together as ‘Second dose’. Nonetheless, as long as these definitions were adhered to, the unvaccinated group should only ever contain ‘never vaccinated’ individuals. But, that said, it is still muddy. What about all the missing individuals? With so much data missing, can we be sure the present individuals got correctly allocated?
At the risk of muddying the water yet more, here is a chart of the weekly all cause ASMRs in the second dataset. For some reason, ONS changed what it reports: in the first dataset, it was covid deaths and non-covid deaths (which we add to get all deaths), in this dataset, it is covid deaths and all deaths (so we could subtract covid deaths from all deaths to get non-covid deaths…) etc etc world without end but anyway here are the all cause ASMRs:
The early peak in the unvaccinated is last winter’s January wave. The fully vaccinated appear to be under a sort of protective halo that gets thinner as time goes by. But what on earth is going on the the one dose groups, especially the 21 days or more after the first dose group? That May/June peak is definitely not covid (typically around or less than ten deaths/day for most of that period). Are these the unrecognised adverse events – strokes, heat attacks, clots and other complications – manifesting themselves a few weeks after the first dose? Why the remarkably high May/June peak, and then the decline? Who got their first dose around April/May time?
Scaling has made the image blurry (original is here), but its the young middle aged. Were they somehow more at risk of adverse events after vaccination than either the elderly or the young? As these are ASMRs, changes in the age structures in the groups are taken into account, but at the same time, it is important to remember ASMRs are not ‘real’ numbers, they are ‘as if’ numbers (as if the group had the same age structure as the standard population), and the actual numbers may be very different.
For as long as ONS decline to release the full data (specifically, cause of death), we can only speculate.
Carol – that is an interesting post, but may be (without doing further analysis) an artefact of the chosen non-linear rate of vaccine rollout. In periods of rapid rollout, the unvaccinated denominator (persons at risk) shifts downwards faster that the lagged reported deaths, so the rate appears to go up. There is also the interesting question of why they didn’t reverse engineer the ONS data (as suggested in the comments) to correct for the lag, and the ‘minor problem’ (again in the comments) that the ONS dataset uses date of death occurrence rather than registration meaning no lag, which may be why they didn’t correct for the lag, because it was already corrected! But it remains an interesting post, thanks for the link.
Paddy – see above – there shouldn’t be misclassification in this data, but then again there might be (the missing numbers etc). It is all very muddy.
dearieme – chattiness is always very welcome. Some of your points have been touched on above, but the big underlying problem with all of this is lack of robust data. We who are looking in from the outside have to push aside the dense curtains, and try and make out the glimmers shifting behind the inner veils.
Another rather obvious factor to consider is that not vaccinated doesn’t necessarily mean not immune, as there will be people in the not vaccinated group who have natural immunity. If, and it’s a big if, the unvaccinated group over time becomes more and more saturated with naturally immune individuals, then a situation could arise in which the vaccinated and unvaccinated have similar levels of immunity, meaning covid mortality and so all cause mortality converge over time. This could explain the recent convergences seen in the older age charts, but it does little or nothing to explain the many other oddities.
Returning to the shifting age mix in the 10-59 year old group as a possible explanation for the curves, here is perhaps the ugliest chart ever published on this blog, which overlays the second dose uptake chart with other age groups (60 and over) removed on the mortality chart. You can just make out the essential details. It shows the mortality lines remain relatively stable during and after the period of maximum change in age composition of the vaccinated/unvaccinated groups. Dr No remains baffled.
Somewhere on his blog Dr Kendrick made a remark about Covid to the effect of: the numbers make no sense and never will.
https://drmalcolmkendrick.org/2021/09/03/i-have-not-been-silenced/
Strongly recommended for anyone who hasn’t yet read it.
My explanation of the fact that the numbers don’t make sense is simple. That is what happens when politicians and corporations hijack medicine. The “facts” and “figures” are being distorted, or perhaps even made up out of cloth, by people who don’t care about the truth or our health.
They have had a lot of practice, inventing pretexts for invading countries to steal their resources, and amusing themselves by seeing just how preposterously unbelievable a story about “the Russians”, “the Chinese”, “the Iranians”, “the Syrians”, “the Libyans”, “the Venezuelans”, etc. has to be before the majority begin to doubt. So far everything has been gulped down to appreciative comments.
Come to think of it, we should have seen this coming when computers were introduced into the electoral process. The technique is laughably simple:
1. Everyone lines up to cast their votes.
2. The machines count up the total votes.
3. Someone in a back room types in the results, and the computer prints them out.
A Stalin may have wisely remarked, it’s not who votes that counts; it’s who counts the votes.
This German chap suspects that the newly vaccinated spread the virus. He shows some data plotted in a revealing way.
https://eugyppius.substack.com/p/booster-doses-are-extremely-dangerous
H/T Revolver
dearieme – that is indeed an interesting post. Note that he is looking at PCR cases in 1st (naive) and 3rd dose (partially naive, ie 1st course immunity is presumed to have waned) vaccinees, where as we have been looking at all cause deaths in the unvaxxed vs ‘fully’ vaxxed (quotes because it seems you are never fully vaxed, if you need constant boosters) ie had two doses.
Here’s a similar chart for England for first dose vaccination and deaths (with 21 days, 21 days or more) after the the first dose. The vaccination numbers come from the weekly vaccination reports here (subtracting week on week to get the number that week) and the deaths (counts, not rates, this time, because we want to see if deaths follow vaccinations) from the dataset used in the original post, and are all cause deaths. The early weekly vaccination reports didn’t do a full age breakdown, so missing data there, and the big dip in the middle seems semi-plausible when looking at the cumulative curves (see image a few comments above this one) and the coronavirus dashboard (all ages), and considering the target deadlines in April and July. The early deaths are presumably among those vaccinated early for clinical or workplace reasons, but not counted in the weekly vaccination reports.
Can we draw any conclusions? Probably not, although the peak in the 21 days or more after vaccination deaths around 5 weeks after the peak in vaccinations is intriguing. But we are up against the usual problem: 10-59 is a very wide age band with very different things going on at the top and bottom ages.
PS added 1630: of course, if there was vaccine associated mortality at a steady rate, we would expect to see the rise in deaths mirror the rise in vaccinations, and the intriguing thing is that we sort of do see that, at a plausible interval, but even that pretty much falls apart under post hoc ergo propter hoc…
Dr No you may have seen this analysis of the same data (in 3 parts), which looks a plausible explanation for your graphs:
https://bartram.substack.com/p/on-the-impact-of-the-vaccines-on
(He also has a good take on the Hippsley-Cox technique, in another post)
We certainly did delay or avoid vaccination only in a very small number of people over 80, those who were very very frail or dying. So an intrinsically unhealthy and select group, the unvaccinated elderly.
Helen – Dr No hasn’t come across Bartram’s Folly before, excellent find. At the risk of piquing himself, Dr No notes that Bartram published the day before Dr No did, using very similar charts, right down to the red shaded boxes indicating when vaccination took place. This is pure coincidence, not plagiarism! We also have the same views about ONS’s data, or more specifically the data ONS chose to publish. Here’s BF’s take on it (from Part 3):
“The data that have been released regarding covid in general, and the vaccines in particular, has been of dreadful quality. Often it gets so close to offering some value, but then it turns out that the data is useless. This is yet another example of that. I have no idea why a statistics group would collate data from such a wide age range, when the main variable, the people who are being vaccinated, has such a strong age dependency. They could have provided data by 10 year interval, like for the older age groups, but they decided not to. Perhaps they’re trying to hide something…”
The selective non-vaccination of the frail is certainly a plausible explanation for the vaccinated/unvaccinated plots, not just for the over 80s, but all three older age groups (Figures 1-3 in the original post). As each group gets vaccinated, those in the group get segregated into the fit (and so get vaccinated) and frail (and so don’t get vaccinated). Those in the fit group mostly survive, many in the frail group die. This raises yet another intriguing question: could vaccination status be a confounder for frailty? In effect, being vaccinated is just a label for better health status, and of itself has no effect on mortality. The vaccinated don’t die not because they were vaccinated, but because they were inherently fitter. An example of our old enemy selection bias at work?
Bartram modifies his analysis here.
https://bartram.substack.com/p/the-importance-of-the-delay-between
“the vaccines are likely to offer some limited protection against death, however, the increased risk of death during the period immediately after vaccination is likely to remain.”
But, Bartram old boy, does that apply to booster jabs too? I hope he gets round to that question.