The Summer of Excess Death
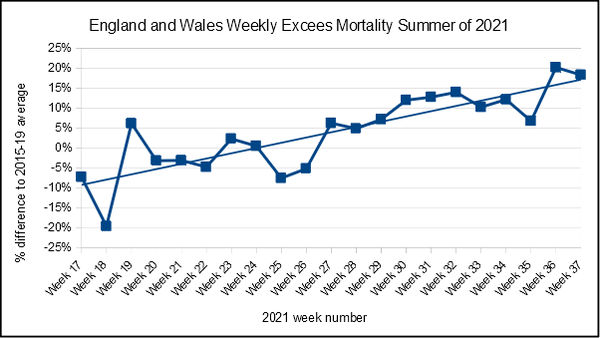
Byzantine formulas unfathomable by man, stretching out beyond five miles of fetid ground, and down to a sunless sea — all very well, but sometimes the simpler analysis better does our pleasure guarantee. The human brain is smarter at spotting a trend in a chart than in a table, and the chart at the top of this post tracks the weekly all cause mortality over the summer, expressed as a percentage difference compared to the average mortality over 2015 to 2019 for the same week, with an added trend line, using ONS data. Anything above the 0% line is excess mortality, and we can see at a glance things are not going well. In fact, we shall all likely be dead pretty soon, if the trend in recent weeks continues. What on earth is going on?
The first thing is that Dr No has used a type of gee-whizz plot to make things appear worse than they are. Instead of reporting and plotting absolute numbers, he has used the marketing man and main stream media’s best friend, relative numbers, to underline once again the importance of not trusting relative numbers presented on their own. The value for week 37 (week ending 17th September) is 18.3%, but 18.3% of what? To add gee to the whizz, the Y axis expands magically, while at the same time remaining unanchored to any real number, as if floating in space. There is no way of knowing where zero is, no way to get our bearings. To do that, we need to plot absolute numbers, and anchor the Y axis to zero, as shown in Figure 1.
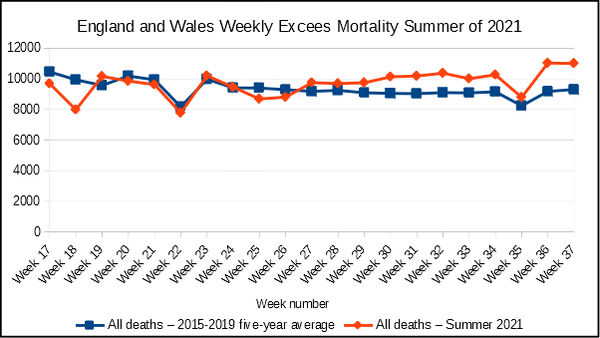
Figure 1: numbers of weekly deaths for England and Wales over (1) the summer of 2021, and (2) the 2015-19 five year average. The deep dips are caused by Bank Holiday registration delays. Source: ONS
Figure 1 is much less dramatic, but there is still something untoward going on. Starting in week 27 (week ending 9th July), weekly mortality rises steadily above the five year average, and stays that way, with the lines continuing to diverge. By week 37, there were 1,703 (the 18.3%) excess deaths over the five year average. The trend has been consistent, and is not trivial. Is this the Nth wave (where N is a random number between 3 and infinity) of covid lapping at the foothills of Mount Britannia? Probably not: deaths ‘involving covid’ may have contributed to the excess mortality, but they are by no means the whole story. Dr No says may have contributed, because we have no way of knowing whether they were expected deaths, in keeping with the five year average, who just happened to die a death ‘involving covid’, instead of some other cause of death, or whether they are true excess deaths.
The ONS data used to produce the previous two plots divides the deaths into those involving covid, and those not involving covid, and so we can get a feel for the extent to which deaths involving covid contribute to weekly excess mortality. Figure 2 shows the 2021 deaths as a stacked bar chart, colour coded to show non-covid deaths, covid deaths, and, in weeks where there were excess deaths, the contribution to excess deaths made by non-covid deaths, along with a line plot for the five year averages. We can see that in most recent weeks when there were excess deaths, the larger contributor, albeit by a small margin, was non-covid excess deaths.
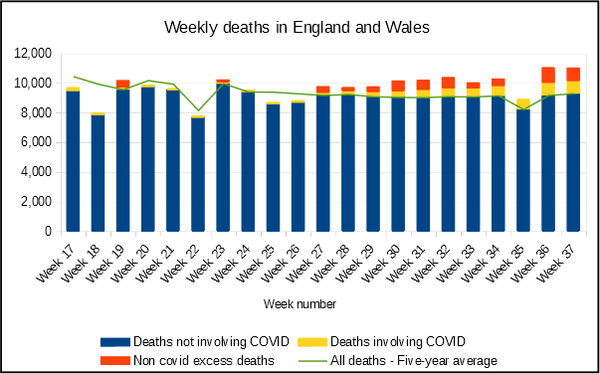
Figure 2: numbers of weekly deaths for England and Wales over the summer of 2021, colour coded to show non-excess non-covid deaths, covid deaths and excess non-covid deaths, along with weekly 2015-2019 averages. Source: ONS
Figure 2 assumes, as noted above, that whenever there are excess deaths, covid always only ever contributes excess deaths. It is entirely conceivable that some of the the covid deaths might instead lie among the lower, non-excess deaths part of each bar, perhaps because they were going to die anyway, and just happened to die of covid, rather than a more conventional diagnosis. To the extent that that is true, the yellow covid parts of the bars get displaced down below the green five year average line, and the non-covid red part of the bar gets enlarged, up to and including the point where all the covid deaths occurred among non-excess deaths, and all the excess deaths are non-covid deaths. We have no way of knowing the extent to which this applies, but we can be sure that any extent to which it applies will mean that Figure 2 under-represents the true number on non-covid excess deaths.
What might cause those excess non-covid deaths seen in recent weeks? There are two candidates that will spring easily to mind for most: the NHS backlog, and, inevitably, the covid vaccines. As it happens, the deaths by vaccination status data recently published by ONS, and analysed by Do No in this post, stops in week 26, just before the rise in excess all cause mortality gets interesting. For the time being — we must hope this will change before too long — we cannot look at mortality by vaccination status for this period. There are however two things we can look at.
The first is deaths by age group, to see if that throws up any leads. Figure 3 shows weekly deaths counts over the summer of 2021 by ten year age bands. Apart from a gentle upwards trend in older age bands from around week 26, consistent with the rise in excess mortality over the same period, there is nothing exceptional here. Figure 4 shows the same plot zoomed into the younger age bands. Again, there is nothing exceptional that stands out.
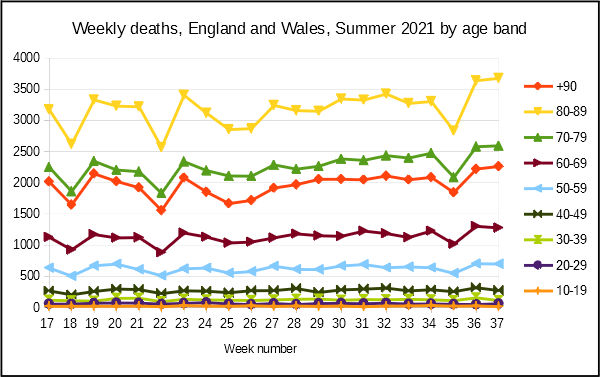
Figure 3: weekly deaths by ten year age band, all ages over 10 years of age. Source: ONS
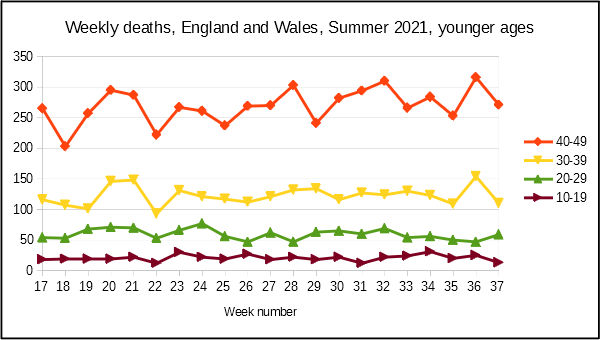
Figure 4: weekly deaths in younger age bands. Source: ONS
The other thing we can look at is vaccination uptake over time. As always, there is the caveat that correlation is not causation, should we feel inclined to jump to conclusions. Nonetheless, timings are interesting: the start of the period of sustained weekly excess deaths coincides with the period when the majority of the population had received at least one dose of covid vaccine, as can bee seen from Figure 5.
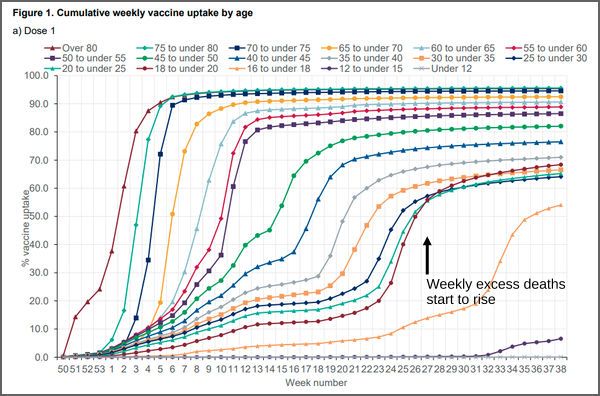
Figure 5: cumulative weekly vaccine uptake by age (England only). Source: UK Health Security Agency (page 10)
Figure 5 does not prove anything, but it does raise important questions. We have an established, sustained rise in excess mortality that appears shortly after a period intense vaccination activity. At the same time, crucial data becomes unavailable. There is a pressing, urgent need for ONS to release full and up to date data for deaths by vaccination status so that an assessment of vaccine related mortality can be made. Unless and until it does release this data, it can only have itself to blame for the inevitable rise in speculation that covid vaccines not only lack effectiveness, they are also downright dangerous.
“The other thing we can look at is vaccination uptake over time. As always, there is the caveat that correlation is causation, should we feel inclined to jump to conclusions”.
Er, something missing? An important negation?
Thanks Tom, corrected.
Thanks, Dr No. And (acknowledgement to Frank Omega) thank you for your superb and unremitting hard work to grind those statistics and inform us all.
I fear that “l’esprit contradictoire” sometimes seizes me so firmly by the throat that I neglect to give credit where credit is due.
There is also this:
“There Is No Pandemic”
https://www.ukcolumn.org/article/there-is-no-pandemic
“Research by an independent statistician, who goes by the pseudonym of John Dee, appears to confirm what many have suspected since the beginning of the Covid-19 pseudopandemic; that the government narrative about the disease is a confidence trick.
“John Dee looked at more than 160,000 admissions via the Emergency Department of a busy hospital. His analysis shows that, for an unnamed NHS trust, between 1 January 2021 and 13 June 2021, of the 2,102 admissions coded as Covid-19, only 9.7% (204) had any supporting diagnosis of symptomatic disease.
“For the remaining 90.3% (1,899) there was no discernible, clinical reason to describe them as Covid-19 patients£.
Excellent work Dr. No. Thank you.
Thank you again Dr No.
If we look at deaths in England & Wales with an underlying cause of influenza* after the deployment of the flu vaccine for all over 65s in 2000, we see an immediate and impressive drop. For the next eight years (2001-2008) we see an average of 300 deaths per year over the preceding eight years. If this 87% fall in deaths was wholly attributable to the vaccine, it was very impressive, though the reduction of 275 flu deaths per year might sound less impressive in these times.
What really interests me though, is what happens from 2009: deaths with an underlying cause of influenza increase until numbers are back at, or above, the numbers from before the year 2000 roll out. Of course, in 2009 we have swine flu, and it gets its own vaccine, then we have the maternal influenza vaccine in 2010, and chidlren’s influenza vaccine in 2013.
Perhaps Dr No can suggest another reason for the immediate and (for 8 years, at least) sustained drop in influenza deaths. But if the vaccine really was reducing the number of deaths so impressively, what caused the bounce back from 2009 onwards? Could it be that vaccinating more people resulted in a reduction in overall effectiveness? Must we assume that swine flu and any other strains which circulated for the next decade were simply more deadly?
I suppose an interesting question, which someone here might well know the answer to, is: have any countries opted to give Covid vaccines to a limited group only, e.g. over 65s?
*not the often mentioned pneumonia & influenza, but simply ICD-9 code 478 and ICD-10 codes J09-J11, hence the low number. Also worth noting that the counting of pneumonia deaths was dramatically affcted by the move from ICD-9 to ICD-10 in 2001, but that influenza numbers were not greatly affected.
Apologies. My second para seems to have got mangled. It should have read:
If we look at deaths in England & Wales with an underlying cause of influenza* after the deployment of the flu vaccine for all over 65s in 2000, we see an immediate and impressive drop. For the next eight years (2001-2008) we see an average of less than 40 deaths per year, as against an average of more than 300 deaths per year over the preceding eight years. If this 87% fall in deaths was wholly attributable to the vaccine, it was very impressive, though the reduction of 275 flu deaths per year might sound less impressive in these times.
An analysis of qualitative data would be useful here to either support or reject Dr No’s quantitative findings (both actual and proposed).
Considering this is a novel ‘treatment’ (is it really medically corrected to call them vaccines?) why haven’t the government followed / tracked every recipient of a needle or two, to gain such insight? It can’t just be incompetence.
The rather sinisterly titled “UK Health Security Agency (UKHSA)” which opened a day or two ago should surely be on it, right?
Or, is it simply a case of see no evil, hear no evil? Expecting the brainwashed to take their (bad) medicine and not ask questions.
James – qualitative data won’t help answer what is a quantitative question: what quantity of the excess is attributable to this or that?
This post is a ‘questions that can’t be answered rather than answers that can’t be questioned’ sort of post. If we can trust the ONS data, and there is no reason to suppose we can’t for weekly deaths, which should be some of most robust and up to date data available, then what this post shows is a sustained period of excess deaths at an unlikely time of year which cannot be adequately explained by alleged covid deaths, alleged because a proportion of alleged ‘deaths involving covid’ probably have nothing to do with covid (see posts passim, eg here). One way of looking at whether vaccines contributed to those excess deaths is by analysing deaths by vaccination status. The problem is this data is only publicly available up to week 26, and the period of great interest starts around week 27. That’s why the post ends with ‘we need the data’.
You are right to question whether the vaccines really are vaccines in the conventional meaning of the term. It all depends on what you intend the vaccine to do, and how you measure it. For example, if you were only to measure antibody response, and make no clinical assessment, then are you really looking at a vaccine, or a sort of immune therapy? That said, the vaccines are variously intended to improve clinical outcomes, and many studies have looked at those clinical outcomes, so in that sense they are vaccines. At the same time, they are definitely, and beyond doubt, still experimental vaccines, with all that that implies for informed consent etc etc.
One of the problems caused by the rapid and widespread roll out of the vaccines is that it effectively blocks doing large controlled trials (because the controls rapidly dwindle). Such studies are also very resource intensive, making them unpopular choices. We are left instead with observational retrospective (and so in no way randomised) studies on deaths rates in the vaccinated vs the unvaccinated, not perfect, but a lot better than nothing. Only we don’t (yet) have the data for the period of interest, starting around week 27.
The UKHSA appeared almost out of the blue (there have been some obscure announcements) and is said to be a replacement for PHE, though it seems to Dr No the remits suggested by the respective titles are different. One supposes the transition from the rather bland sounding Public Health England to UH Health Security Agency is yet another post 9/11 attempt by government to increase fear and tighten sphincters across the general public, on the grounds that a people in fear are easier to manipulate than relaxed happy-go-lucky types. Indeed, giving the people something to fear and loathe is a well recognised step on the path to authoritarianism.
Misa – influenza surveillance has always been bedevilled with all sorts of compromises, ranging from monitoring consultations for ILI (influenza like illness) in general practice (so very vague) to assuming most excess winter deaths are probably flu deaths. True laboratory confirmation of diagnosis (by viral culture) is rare, so those numbers are always going to be small, and there may be year on year changes in practice that affect the numbers. You are right to point out the important variations caused by changing coding practices over time, yet another bedevilment. And that’s before the numerologists starts cranking the numbers. A perfectly innocent sounding and potentially relevant paper with a title like “Mortality caused by influenza and respiratory syncytial virus by age group in England and Wales 1999–2010” turns out to have buried in its bowels one of those Byzantine formulas unfathomable by man:
Do you by any chance have a link to a simple time series ideally with age bands that covers from well before the year 2000 to some time nearer the present day? The data should be in annual ONS mortality reports, but has anyone collated them into something human readable?
More generally, the flu vaccines are not particularly effective. CDC for example publish a summary of effectiveness for a number of past flu seasons, and the VE (vaccine effectiveness) is typically less than 50%. In some seasons the VE confidence intervals include negative numbers, presumably meaning the jab might even give you flu in certain circumstances…
Not aware of any countries that have deliberately limited vaccination to particular groups (others may know otherwise). On the other hand, we do have some rather loose and transient in-country variations, caused by differential roll out (see, for example Figure 5 in the post, around weeks 10 to 15).
I have managed to extract numbers of influenza deaths by age from the ONS mortality data. Will drop you a note.
I have a friend in Alberta, Canada. Figures from there for September 2020 and 2021 are striking:
September 2020, no ‘vaccinations’* as yet, revealed 358 new cases, total active cases at 1,458, hospitalisations at 51, with 9 in ICU. In September 2021, with 72.8% fully vax’d and 83% with one dose, the new cases were 1,519, total active cases at 20,917, hospitalisations at 996, with 222 in ICU. As was said about it, ‘There are 14 times the active cases and 20 times the hospitalisations this year, because of the 17% unvaccinated?’ And these sorts of figures shine forth from almost every country in the world, yet people are already queuing up for their ‘boosters’?
One thing ‘they’ managed horribly well was the feeding of the belief that ‘It could have been worse, and people felt more ill when still succumbing, if they hadn’t had the ‘vaccine’.’
James, I think your last sentence says it all. And the UK Column’s take on (Y)UKHSA on Friday was illuminating, to say the least. It’s certainly not what was suggested some months ago.
Apologies; I omitted to say, my ‘*’ after my first use of the word ‘vaccine’ was to say I use inverted commas when I write it because, no, imho, it’s not a vaccine. Or it’s most certainly not being given as a vaccine. Time will/might tell what it is.
Annie, the UK’s columns were more preoccupied with a self fulfilling, fuel shortage prophecy to take much notice!
That with a double page spread in the Daily Mail printed last week as a gov ‘advatorial’ (made to look like a genuine article) advocating the safe injecting of children, they would look, at the very least, hypocritical if they were to critically comment on the newly formed gov agency.
Objective journalism is dead!
Annie (and James) – as you both know, on the question of when is a vaccine not a vaccine, Dr No tends to take a sanguine view. Whatever it is (Dr No keeps an open mind), it is incontrovertibly new and experimental, so no one knows what the medium to long terms effects will be – a fact which in Dr No’s opinion is sufficient for any individual to chose to withhold informed consent – and then there is the problem of the mass roll out. If the vaccine (or whatever) causes harm even in only a small proportion of cases, the numbers could still end up being huge.
Dr No was also reminded the other day by another reader of the Dr Martin files (the American PhD, not our much beloved Cornish GP, who would have known exactly what to do with covid) which claim all manner of malfeasance, more than enough to make the ears pop. As you say Annie, time will tell (and it is will, not might, as one day, one way or another, the truth will out).
First, do no harm.
From TV’s farcical ‘Dr Hillary’ to many other countless, less none, but equally complicit medics – consideration for patient safety has been washed away in a tide of pharma and big tech interest, with hardly any mainstream media scrutiny to offer balance and moderation.
Amounting to (dis)informed consent.
Slightly off-topic – there’s a suggestion (but I can’t find where I saw it) that some of the post-jab reactions might be because the (inexperienced and partly-trained) jabbers do not aspirate when injecting, so could be accidentally injecting IV instead of IM. So the concoction spreads all around the body, instead of remaining in muscle tissue, which might account for autopsies finding traces in many organs.
Ed P
Dr. Sucharit Bhakdi is a useful reference in relation to what happens post jab, in particular the lining of the blood vessels.
Look up on Rumble rather than YouTube.
@Misa: any interest?
https://pubmed.ncbi.nlm.nih.gov/32120383/
dearieme, that is. Thank you.
James, I might have been unclear about ‘the columns’, but was referring to the UK Column News – an excellent outfit offering balance and consideration. They are certainly watching the John Dee data – as mentioned by Tom above – with wide open eyes and minds. Dr Bhakdi’s work is also of such importance, yes.
Dr No, indeed time will tell, but I’d rather it ‘told’ well before the mass graves and huge loss of life which might – as Dr Bhakdi suggests with such clarity – appear before our eyes before too long. I’m not anti-vax, but this bizarre concoction*, and equally bizarre method of ‘it’s not mandated, but no jab, no job, and giv’us yer two year old whilst you’re at it’ insistence on everyone having it, has me strongly doubt there’s anything ‘vaccine’ about it at all.
(* The insistence of the recent revealing of ‘the one previously withheld secret ingredient’ ending up with it being ‘water’….?? I mean, really…? If hiding any part of the content, let alone water, doesn’t raise suspicion, I don’t know what does.)
Ed P, and Dr No, I have long been fascinated by the notion that something being injected into a muscle can stay in that muscle; muscle being packed with blood vessels, which, by their nature, are connected to every other part of the body, surely? Even as food goes through massive change from mouth to mitochondria, but essentially can upset various people at various stages, and face creams can cause everything from allergic reaction to cancer, so surely can this ‘injected substance’ change, shift, and cause untold havoc all over the body?
Yes, first do no harm. And much harm is happening. Time to stop harming, and then to work out the whys…
Annie – you are right, we should not wait until the huge loss of life that might appear. This is why we need up to date data now, so we can see in as near as possible to real time what the adverse effects as and they (if any – caveat needed because we don’t know) they appear. It is possible the gloop does have some minor benefit, and doesn’t have significant adverse effects – in effect, it is like the current flu vaccines – and if that turns out to be the case, then those who want to have the vaccine should not be denied that possibility (we have to remember that free and informed choice includes the possibility of accepting the vaccine, as well as rejecting it, and it is not for us to make decisions for other people: that’s what their free choice means). All of what Dr No has just written is thick with ‘ifs’ and ‘possibles’, and that is why informed consent has to include what we don’t know about the gloop just as much as what we do know.
Lipid nanoparticles, or LNPs, (the gloop’s vehicle, or Tojan horse, depending on viewpoint) certainly gets distributed around the body, whether it is injected correctly into the muscle, or into a blood vessel by mistake. The infamous Pfizer Japanese pharmacokinetics document (see “2.6.5.5B. PHARMACOKINETICS: ORGAN DISTRIBUTION CONTINUED” on what is actually pages 16 and 17) shows that a surrogate mRNA doped LNP injected at high dose into rats ends up all over the body, albeit in very small concentrations in most organs except the liver (the metabolic powerhouse of the body), and the only way it can have got to those organs is via the blood stream. The same document appears to suggest that at least some of the metabolism occurs in the liver, which may explain the high liver concentrations.
Because the regulatory authorities tend to take a ‘no need to bother with that sort of nonsense round here’ approach to phamacokinetic and metabolism studies for emergency use authorisations, the truth is we don’t really know that much about the biodistribution and metabolism of the covid mRNA vaccines, beyond the hints available in the Pfizer Japanese document.
The http://www.ukcolumn.org website linked to by Tom does have some interesting articles on it, generally sceptical of the official narrative. Can’t speak for the video content – as many know, Dr No doesn’t really do 90 minutes of talking heads!
Dr No, exactly; we should not wait. I appreciate the Japanese document says what it does, but it is also Pfizer’s document. There are many, many, (many) more giving more up to date and less biased (although is there such a think, of course, especially in 2021) information. To me, the vast numbers racking up on the VAERS and Yellow Card Scheme, and the percentage rise in deaths and injury from such high numbers of specific medical conditions (even if the beeb wants us to believe that 110% of every young person’s previously undiagnosed heart complaint was there all the time, and that the large order of blood thinners is nothing to do with anything) suggest something more than ‘might’.
I can’t help but imagine the old days of informed consent and the receiving an injection: in the surgery, from a doctor, with the PIL present and explained, the trial nature of the ‘gloop’ explained, and (if it was around then) advice to check out the information on the Yellow Card Scheme, ‘as there are a high percentage of reactions to consider, and even deaths’. Along with, of course, ‘It might well help, but we don’t know yet; it’s still in trials until 2022/23 – and, by the way, your’e part of the trial’. Likely, having come for a jab, they wouldn’t be interested in leaving without a jab, but time and data would have been available to give as inform-ation to consent to. Now it’s a quick drop in to a booth in Primark, whilst shopping for a winter coat, a person who’s had an hour’s training, no PIL – and even if present, having nothing on it except, in tiny print in the middle of the truly vast piece of paper (are they readying for the mammoth numbers of contraindications and warnings they know will need to be there when emergency use is ended, I wonder?) saying, ‘Intentionally blank’. Matey however, desperate to get to Toremolinos, just rolls up their sleeve, in goes the gloop, and they’re on the book of faces within five minutes, saying, ‘Brilliant! I was in and out in 4 minutes*! I’m off on my holibobs – yay!’ (* Seen that with my own eyes too many times now.) Yes, some jabs are given in surgeries, but ours is resolutely shut, windows barred, and ‘Go away – call 911’ on posters in the window. For those who want it – or who are ‘not-forced-but-no-jab-no-job-coerced’ – it’s down to the Weymouth Pavilion car-park, where the waiting ambulances have their back doors open in readiness… To me that’s far, far, far from good enough.
Has Dr No looked into the graphene topic at depth? Would be most interested in his views. This, from 5 years ago (which I hope it’s ok to post here), I found to be somewhat eye-opening (understatement!) A six minute ‘young scientist’ video on ferrofluid and nanoparticles, potentially for ‘future pharmaceutical use’. I can’t help wondering, if the stuff is so wonderful, why all the secrecy and blatant denial around its possible presence in the gloop under discussion here… https://www.youtube.com/watch?v=mj8Yz2QGd7w
Yes, great articles on the UK Column News website, giving the written version of the talking heads, so it’s all well covered for everyone.