
Failing Mothers to Save Grannies
Recent seasons of Call the Midwife have become so sudsy that it can only be a matter of time before a baby disappears down the sluice, lost in soapy foam. Cyril has now got both religion and his girl, Lucille, and radiates joy, like a light bulb. Dr Turner, the GP who cares so much that it hurts, has had his early constant expression of quizzical amusement at the follies of his patients change into one of tortured anguish, as if all the human suffering of Poplar has been etched permanently into his face. Sister Julienne is showing early signs of being subject to a corporate take over — perhaps the writers want to warn us about what is happening to the NHS in 2021 — and Sister Monica Jones has upped her LSD habit, with deleterious consequences for her thought patterns. But even as the levels of Fairy Liquid have increased, the series has remained a true picture of traditional medical and midwifery practice, including, most importantly, tireless and valiant attempts to combat the harmful effects of the inverse care law.
The inverse care law simply states that those who are most in need of health care are the least likely to get it. It is a fundamental law, like that of gravity: those most in need sink to the bottom of the pond. It is universal, in that it applies in all places and at all times, and because it is universal, it needs a constant and determined effort to lessen its harmful effects. One of the most effective measures against the inverse care law is to improve ease of access to health care for those least likely to access health care: simple measures, like local clinics, and outreach teams. One thing you should absolutely not do is restrict access to services, and yet, that is exactly what lockdowns do. Not only do they create an explicit interference with normal access, they also implicitly interfere, by creating a climate in which all, but especially the medically shy and timid, are pressurised into believing they should not trouble the health service in a time of crisis. Stay Home, Protect The NHS, Save Lives. On one reading, the message is stark: do not bother the NHS at a time of crisis.
There are many avenues for exploring the harmful effects of lockdown on healthcare. Some of these are broad brush approaches: we can, for example, look at excess overall non-covid mortality in care homes and private homes, as Dr No did here and here. More specific effects are harder to tease out, and will take time. Mortality from missed or delayed investigations for cancer, for example, will only appear after an interval, and other specific causes, for instance cardiovascular disease, can only be looked at once we have mortality data broken down by cause of death. But there is one specific death which is separately and accurately recorded, in something close to real time: the deaths of live fetuses that give rise to stillbirths. Although not strictly speaking a mortality statistic, the stillbirth rate — the number of stillbirths per 1,000 live births and stillbirths — shares many of the characteristics of mortality statistics, in that it is inherently reliable and readily available, and furthermore, there is very little time lag: the effects of failed antenatal care on the stillbirth rate quickly become apparent.
Let us hypothesise that the effect of lockdown is to aggravate the inverse care law, and as a result some of the more marginalised pregnant women who might in more normal circumstances have come forward do not do so. Instead, they stay at home, to protect the NHS. Even worse, the NHS tells them to stay at home. Warning signs of an imminent stillbirth, for instance reduced fetal movements, are not heeded. The pregnant woman who does ring in is told there is no need for a face to face consultation, so she does not get examined, or the baby monitored. As a result, we hypothesize, the stillbirth rate goes up, and this effect should be visible in the stillbirth rate. What do we find when we look at the data?
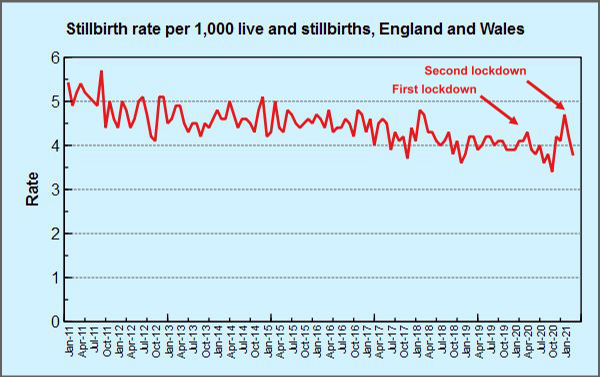
Figure 1: stillbirth rate for England and Wales. Source: ONS (Table 5)
Figure 1 shows the stillbirth rate by month for England and Wales for the last decade. Since these are rates (per thousand live and still births), we have taken care of any fluctations in the underlying birth rate. Two spikes are clearly visible, one in April 2020, corresponding the first lockdown, and one in January 2021, corresponding to the second lockdown. ONS in their own commentary are inclined to dismiss these spikes a likely to be random variation in small numbers: “However, there are relatively low numbers of stillbirths each month, and the stillbirth rate in January [2021] is just within the plausible range that we might expect to see from random variation”. In keeping with this, their chart (Figure 2 is a slightly compressed version, to get it to fit on this page) presents the data in a different way that rather discourages direct like for like comparison with previous years.
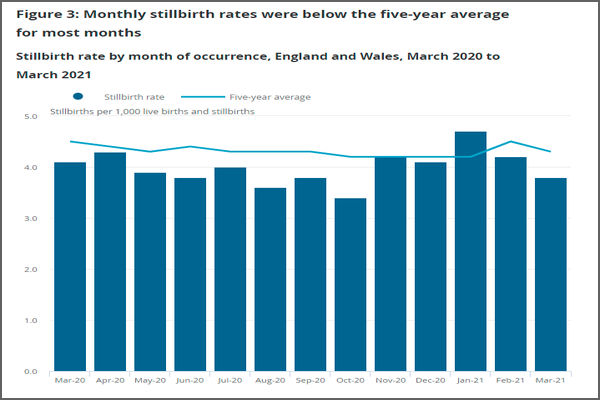
Figure 2: monthly stillbirth rate chart for England and Wales from ONS
The monthly numbers are relatively small (unless you happen to be one of the unfortunate mothers), but they are not that small; the underlying counts are typically between 200 and 300 per month. But more to the point, when we see the last decade as a simple series over time, as in Figure 1, we can both see the underlying trend over time, a falling stillbirth rate, and the two recent spikes stand out, in much clearer focus. The ONS presentation, on the other hand downplays the visibility of these two spikes.
Association is not causation, of course, and the numbers, though reliable, are indeed relatively small. There is also a rather obvious, and unexplained, decline in the stillbirth rate between the two spikes in April 2020 and January 2021, though it is not far away from the long term trend. Nonetheless, two clear spikes did occur, coinciding in each case with a lock down. On Goldfinger’s Rule of Three, this moves us from happenstance to coincidence, and while coincidence is not proof, it is an oddity.
True, but there were also notable spikes in 2011 and 2018.
(i) Once enough nubile women have been vaccinated it will be interesting to see what their rate of stillbirth is.
(ii) Are there ever firm enough figures to allow analysis of the rate of birth of badly handicapped children?
Chart 1 — what happened around July 2011? A spike and an over-correction? Before it was bouncing along just above the 5 level, thereafter 5 appears to be a ceiling. Were definitions changed, did someone have a metric/target to fit?
There are earlier spikes, and we can see them, that’s the advantage of charting the data as a continuous time series, rather than as a recent five year average, as ONS chose to do. Small number random variation will have contributed some spikiness, but how much? When does a signal become a signal? It’s the age old signal to noise problem that has been discussed many times on this blog and elsewhere.
There is evidence that antenatal services were reduced during the pandemic eg here but those reductions also applied during the period between the two spikes, when the stillbirth rate reached the lowest rates seen in the last decade.
On balance, unlike ‘covid’ deaths in the elderly, where there may be a temporal displacement effect (people die a few weeks/months early, and so there are less deaths in subsequent weeks months), stillbirths due to lack of antenatal care are unlikely to be brought forward, instead, they just happen when they shouldn’t happen, so a downswing after a spike because of the spike is unlikely. In effect, you have extra still births, not temporally displaced stillbirths.
The definition for stillbirths has been the same since the early 1990s, so a change in definitions can be ruled out (although it should be noted that in some cases distinguishing between a stillbirth and a very early neonatal deaths can be difficult, so perhaps one should also look at neonatal deaths). The targets have also probably in effect remained the same: the lowest stillbirth rate possible, using all reasonable obstetric measures. Universal caesarean section at term might reduce the stillbirth rate, but at great cost to the mothers, hence all reasonable obstetric measures. A strong drive to reduce caesarean sections might conceivably have an effect of increasing stillbirths, but that seems unlikely given the long term decline in stillbirth rate.
dearieme – this post is about the possible harms from lockdown, not from covid itself, or any gloop deployed to prevent covid. There are some for now fringe concerns about effects on fertility, and they have yet to be refuted or substantiated (ie another we don’t know yet). Dr No also notes that in medicine we do not refer to ‘nubiles’ (even if we do have plenty of other colourful language), instead we use terms like fecund, fertile and women of child bearing age. We’re usually aware of it because forgetting to consider whether a woman might be pregnant is one of the easiest and sometimes most catastrophic mistakes a doctor can make.
Not sure about stats on births of badly handicapped children. Google suggests stats do exist, but how reliable they are, and whether they available over time is another matter.
Can this be true? Blog post entitled “Once upon a time” 2021/09/24
https://market-ticker.org/akcs-www?blog=Market-Ticker-Nad
It’s certainly true, insofar as there is a published paper behind the blog post, available here (the blogger, Karl Denninger, also links to it). It’s a retrospective case series, so not the most robust form of evidence by a long shot, but nonetheless interesting. On a positive note, diagnosis was based on clinical history/examination and subsequent serology, so no sewing machine tests involved. One reservation is there was zero mortality once the treatment protocol was in place despite the age and comorbidities of the study population. Perhaps the antihistamine/antibiotic combo is the golden combo that cureth all…