Utterly Chilling

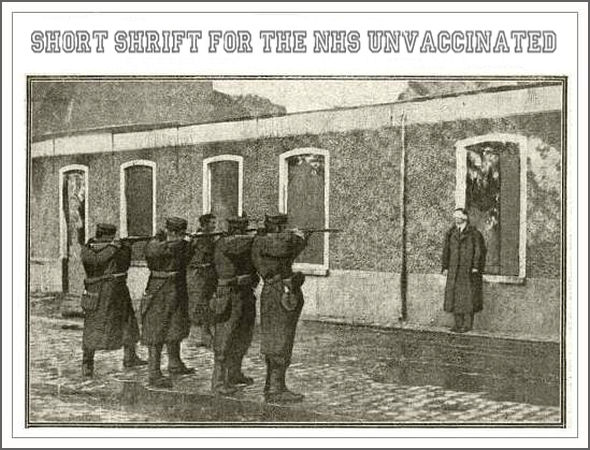
It has been a long time coming, as we enter the final stages of the rollout of the NHS (Self-Destruction) Regulations 2022. After a two year period unlike anything ever seen before in the NHS, with a seriously demoralised and depleted workforce, NHS managers are gearing up to fire many tens of thousands of NHS frontline staff. The managers and their staff are, of course, just following orders, following in the footsteps of others who, at times of moral darkness, just followed orders, and removed innocent undesirables from their midst. What makes the NHS managers so remarkable in their behaviour is that the undesirables aren’t innocent aliens, they are instead a significant part of the NHS frontline workforce. The generals, in effect, are gearing up to shoot their own troops, at a time when they need them the most.

Read more

All Cause Mortality, Again

***Correction 0848 02/12/21: The 45-64 age band chart lost the 2020 line – Dr No apologises. Now corrected, and with marginally better colours. This styling will also be applied to other charts in due course. One phrase, ‘unlike the all ages and older ages charts’, removed from chart commentary*** ONS’s weekly mortality reports have rather gone off the rails for the last two weeks. A week ago, the familiar high profile double humped weekly deaths chart got disappeared, perhaps because the 2021 line was misbehaving. Earlier today, this week’s day late report opened with an estimate of homeless deaths in 2020. The reference has since disappeared, but while it was there, one naturally felt great pity for the homeless deaths, who even now must be wandering across the great plains, looking for somewhere to call home. Dr No suspects ONS might have meant deaths in homeless people. Perhaps next week it will be deaths in parachutists, which ONS will refer to as registered parachute deaths. Sooner or later it will no doubt be alcohol deaths, or rather alcohol related deaths, because in public health, one is never more than a short step away from the demon drink and its deadly toll. But Dr No’s attention is being led astray by ONS’s diversionary tactics. Once again, it is time to look at all cause mortality.

Read more

Lies Damned Lies and Denominators

There has been some conflation and confusion recently over ONS’s initially intriguing but ultimately infuriating deaths by vaccination status reports. They intrigue because they offer a possible route to the paired holy grails of vaccine effectiveness and vaccine safety. A number of bloggers, including Dr No, have gleefully thrown eye of newt and toe of frog into the bubbling cauldron, only to be rewarded with a poke in the eye from a howlet’s wing. A couple of tyros have even added time warps to try and make sense of the data, only to reach uncertain conclusions. Throughout the melee, the focus has at times shifted from numbers to rates and back to numbers again, at others, from covid deaths to non-covid deaths and even all deaths, but the data has work-hardened as it has been worked back and forth, and cracks have begun to appear. Perhaps the cracks were always there, we just couldn’t see them.  

Read more

When the Facts Change

When the facts change, we’re supposed to change our minds, but what do we do when the facts don’t make any sense? If we followed the doctrine often attributed to John Maynard Keynes, we should probably stop making any sense, and go mad. Such thoughts occurred to Dr No as he contemplated another silent but deadly dataset released by ONS a couple of weeks ago. It extends the previous release of covid deaths by vaccination status, which ran from January this year to early July, to late September, and so covers a period of considerable interest. Just as before, the published report only covers covid deaths1, and needless to say, the vaccines are shown to be wonderfully effective. Tractor production continues to rise. But, again just as before, buried in the underlying dataset are the weekly numbers for all cause mortality. All cause mortality, as readers familiar with these things will know, is normally the most unadulterated mortality data there is, unfogged by distractions about diagnostic fudgery. A stiff is a stiff is a stiff, the whole stiff, and nothing but the stiff. What all cause mortality lacks in detail, it gains in robustness.

Read more

The Needle and the Damage Done

“Even the perpetrators had to go one step at a time, completing each step before they realised that the next one was possible.” Clive James, Review of Holocaust (BBC1), 1978 Whither Covid Vaccines? Yesterday, Secretary of State for Health Sajid Jabbit confirmed in the Commons that Covid vaccination will be compulsory for all frontline NHS staff in England by next April. Rumour has it that J-Day will be set for the 1st April, an unfortunate choice, raising the question of whether Jabbit is a joker, or a fool, or perhaps even both. Certainly the Royal Colleges and Unions are up in arms, pointing out that banning qualified healthcare workers from working — a sure fire way to make enemies and alienate people — at a time of NHS crisis is foolish in the extreme. Many, including Dr No, have questioned the ethics of mandatory healthcare worker vaccination, but this is a tricky one, because of vaccine precedents in healthcare, even if those precedents were, and remain, a condition of employment, rather than a legal requirement. And then, last but by no means least, there is the prickly question of the medical evidence: do covid vaccines reduce the risk of covid transmission?

Read more

Montezuma’s Revenge

A recent paper, published at the end of last month, did the obvious, a scatter plot of covid vaccination rates against recent cases for 68 countries, and got the sort of plot that looks like a loo pan after it has been used by a person with a particularly bad case of gas powered Montezuma’s revenge. Dots everywhere, but very little focus. Such a scatter plot suggests there is no connection between the variables, or in the case of covid vaccination, it has no discernable effect on case numbers, despite the fact the authors fitted a trend line that suggests a slight increase in case numbers in countries with higher vaccination rates. As ever, we have to remember that cases is a misnomer: they are merely positive PCR tests, that may or may not also be cases, and of course, just as correlation is not proof of causation, so too is the opposite true: lack of correlation is not necessarily proof of no connection. This applies particularly in a cross sectional study such as this, where the epidemiologist’s sword has cut a slice through a single moment in time.

Read more