
The Loneliness of the Long Distance Shedder

For some time, Dr No has been bothered by the fact that some people with covid continue to have positive PCR tests long after they can be considered ill and infectious. These people, the long distance shedders, will, because of the way cases are defined and counted, appear as cases, even when clearly they are not cases. They will themselves suffer the loneliness of imposed but pointless self-isolation, but they will also inflate the apparent size of any covid wave, and in so doing aggravate alarm and panic, despite the fact that aggravation is unfounded, because they are not cases, nor are they infectious. In short, every covid wave is inflated, and the question for today is: by how much does the way we count covid cases inflate our estimate of the number of true cases?
This is not an easy question to answer, but Dr No is going to have a stab at answering it anyway. He will get almost too close for comfort to doing some of that dratted numerology, but it is necessary if we are to get something of an answer to the question. He will go though some of the facts estimates and assumptions needed to get ‘a good enough answer to the right question’, rather than an exact answer to the wrong question, and apply them to a hypothetical epidemic curve. Note the upfront declaration of the use of estimates, assumptions and hypothetical curves: this isn’t precision engineering, it is more a case of doing good enough science on the hoof. Consider it more of a discussion paper, than a done and dusted conclusion on the matter.
The facts, estimates and assumptions to consider are the course of covid in a cohort of patients. For convenience, Dr No will say the duration of true infection, including the pre-symptomatic interval, and infectiousness is the same, at two weeks. The is the red line in the chart in Figure 1, the period during which live virus can be isolated from the patient. This chart comes from a paper published in JAMA, and although it only shows estimates, it is in broad agreement with other reports, for instance Figure 1 in this paper. He will then say that, in the pre-symptomatic phase, a PCR test, if done, for whatever reason, is likely to be positive, as it is in the week after the onset of symptoms. These are true positives, a positive PCR test in a patient who really is infected and infectious. Finally, we need to estimates the numbers, or rather percentages, of long shedders, shown by the blue line in Figure 1. Eyeballing the chart, with the aid of an onscreen ruler, we can see that in week 2, some 89% of patients remain PCR positive, even though they have cleared the infection. The corresponding percentages for weeks 3 to 6 are 63%, 29%, 12% and 8% respectively, with long shedding effectively over by week 7. These percentages don’t need to be precise, reasonable estimates are good enough for our purposes.
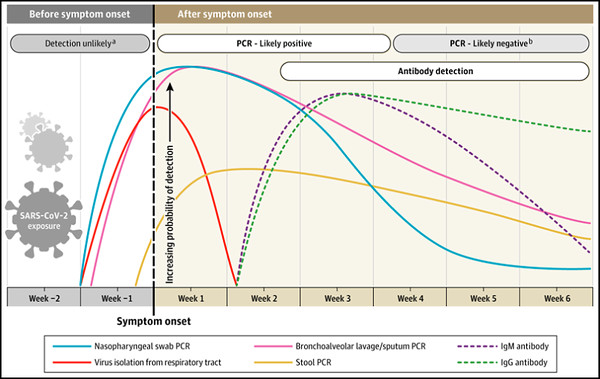
Figure 1: Estimated time intervals and rates of viral detection are based on data from several published reports. Because of variability in values among studies, estimated time intervals should be considered approximations and the probability of detection of SARS-CoV-2 infection is presented qualitatively. SARS-CoV-2 indicates severe acute respiratory syndrome coronavirus 2; PCR, polymerase chain reaction. aDetection only occurs if patients are followed up proactively from the time of exposure. bMore likely to register a negative than a positive result by PCR of a nasopharyngeal swab. Reproduced from Sethuraman N, Jeremiah SS, Ryo A. Interpreting Diagnostic Tests for SARS-CoV-2. JAMA. 2020;323(22):2249–2251. doi:10.1001/jama.2020.8259
Next, Dr No generated a hypothetical epidemic curve using R, a mathematical computing package. He set the duration of the epidemic to be 100 days (near enough three months, so say March-April-May, of November-December-January, and the total number of cases to 100,000. He then, for each day during the epidemic, summed both the true (new, incident) cases with the numbers of long shedders still hanging around, using the percentages given above. Thus, for example, on any one day, of 100 patients in week 3 after symptom onset, 63 of these now well patients will still nonetheless contribute positive PCR tests to the pool; and so on for the other days. This calculation was done in Excel (easier, and more transparent, than trying to do it in R), and the file is available here. He then plotted the two curves, one for the true cases, counted as such in their first week of illness, and on for the apparent cases, that is, true cases plus long shedders, as shown in Figure 2.
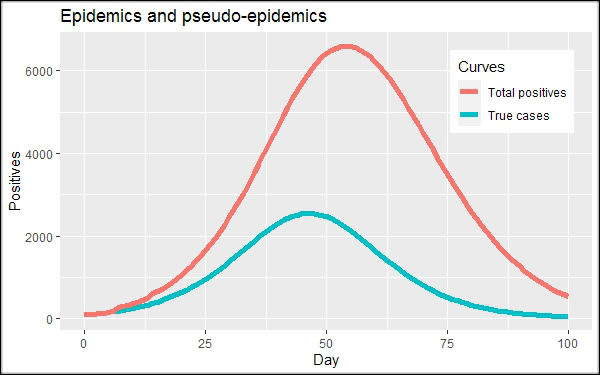
Figure 2: Hypothetical epidemic curve: lower curve is true real cases, counted on the day the became symptomatic/tested positive; upper curve is true cases plus all those long term shedders still hanging around…
Clearly the total number of positive tests on any one day rapidly starts to over-estimate the true number of cases, as all the long shedders get added to the count. But this is the ‘God’s eye view’ of this hypothetical epidemic, in which we know the PCR status for every patient on every day throughout the epidemic. In the real world, while we might assume that most ill people will get tested when they are ill, and so will show up as true cases at the time when they are ill, the same cannot be said for the asymptomatic and post-symptomatic individuals, as only a fraction of them will get tested. So lets cut the number of tests, and so positives, by half. Figure 3 shows the resulting plot.
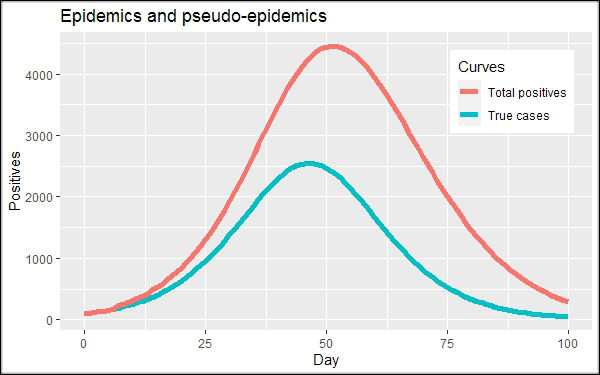
Figure 3: as Figure 2, but with the long shedder counts cut back by half. Note the chart is the same size as Figure 2, but the Y axis scale is different. We still clearly have a testdemic, with the apparent number of cases far in excess of the true number of cases for most of the epidemic’s duration
Another real world factor is that not all true cases will get tested, in other words testing will only be applied to a sample, not the whole population. As long as the sample is a random sample, or near enough a random sample, this will have no effect on the overall conclusion, that long shedders materially alter the apparent size of the epidemic. Any sampling bias that does apply is most likely to affect the long shedders more than the true current cases; for instance, the worried well may be more likely to get tested, but Dr No suggests this is unlikely to have a major impact of the general findings. Readers are invited to contribute any possible biases they consider relevant in replies to this post.
As Dr No pointed our early on in the post, this isn’t a done and dusted piece of work. For a start, Dr No is only a jobbing mathematician, if that, and there are too many estimates and assumptions in play for it to be conclusive. Instead, it provides an insight, through a worked example, into how long shedders do have an impact on the apparent numbers of cases, with, as can be seen, the greatest impact at the peak of the epidemic. The only unanswered question — after the obvious is this all just a load of old Dr No baloney — is: how many of the ‘cases’, or more correctly test positives, on the government’s corona dashboard are true cases, and how many are testdemic non-cases?
Q: ‘The only unanswered question….is: how many of the ‘cases’, or more correctly test positives, on the government’s corona dashboard are true cases, and how many are testdemic non-cases?’
A: As many as the gov’s dashboard fancy putting there.
And all despite Dr No’s excellent effort and brain-wringing attention to detail, 1% of which from the gov might possibly make a modicum of sense out of their to-suit-the-money-hunt number crunching.
This, however, would spoil everything. So they just say how sorry they are, and Britain can do it, and I, for one, don’t believe a single word they say.
It’s become very hard to trust any of the data and I think most people are numb to the figures, if they are aware of them at all.
One thing that I’ve been puzzling over in recent weeks is that if indeed we do have a turbo-charged virus then shouldn’t the death rate be equally turbo-charged by now? If prevalence is 2% as BoJo claims then that’s close to 1.5 million people with the virus right now. So either the fatalities have to rise very significantly or the new variant is less deadly. We will see
A friend has a story about an acquaintance of his. The old boy has had his first Pfizer jab and is due his second next week.
For the first jab he shared a taxi with a neighbour for his return trip to the hospital. He plans to do the same for the second.
Should I laugh or cry?
dearieme – perhaps both. It’s a crazy world right now.
The 2%/one in 50 (same difference) figure winging its way round the media is suspect. It is not ONS’s routine weekly release for its covid infection survey, it appears instead – information is sparse – to be a response to a request from an undisclosed source for ‘Estimates of COVID-19 cases to 2 January for England, regions of England and by cases compatible with the new variant’. The spreadsheet provided as the response is here and it is very short on detail (no methodology given) but crucially the widely quoted figures are ‘estimates’ and the rest of the spreadsheet is made up of results from modelling, suggesting the ‘estimates’ may well be based on modelling. Perhaps someone at ONS hacked Fergie’s computer and ran some models using Fergie’s code. Perhaps someone at ONS made up their own model/code, and ran a few what if scenarios? Who knows?
Shawn – the latest rise (as reported on the corona dashboard) in ‘cases’ ie test positives started at the very end of November, getting on for six weeks ago. The rise is on the steep side, but appears linear, not exponential. Admissions have followed the same course, with no lag – a bit odd. Deaths show a similar pattern, but a much shallower rise – again, a bit odd, given median infection to death time (say three weeks? but it probably has a very wide range). Current daily deaths are still only just over half what they were in the spring peak. Certainly one possible explanation is that the new variant is less deadly.
We are quite used by now to this phenomenon. People with a past history of clinical Covid infection, tested routinely on hospital admission, testing positive sometimes months down the line. Though sensible clinicians can make a clinical judgement about how to interpret the result, the zombie strands of dead RNA count as another ‘case’ in the statistics. Ditto for people being tested for occupational reasons. This has a temporary, though not insignificant, impact on the people and organisations behind the new statistic.
The issue there of course is asymptomatic testing.. but also repeat testing these people during every subsequent upper respiratory infection runs the risk of generating more legacy false positives and fuels reports and rumours of getting Covid twice.
Of course this also means the IFR of Covid is potentially underestimated, due to the dilution effect of counting one infection multiple times (though some of these legacy non-infectious positives will be first time tests).
I have no doubt that the reports of the NHS currently being brought to its knees by clinical Covid in London and other regions are true. It would be good to know how many hospitalised patients with PCR positive have clinical Covid but that is not an easy task. Counting the patients with typical (but not pathognomonic) x-ray findings and typical respiratory symptoms would be a start, but for the elderly we have the atypical presentations…
Given the costs involved and the abject failure of test and trace/track and trace it seems sensible to stop testing asymptomatic people. But I also wonder of the value of widespread testing full stop. Imagine how the summer might have have been were it not for testing.
Surely a useful first step – and one that I would think easy to implement – would be to restore the proper meaning of the word “case”. It should be applied only to people who are definitely ill, as diagnosed by a doctor. (Whether in person or remotely is a fine point). It is bound to be grossly misleading to perform PCR tests for a single virus on as many people as possible – but not for other viruses. How many people have become Covid-19 “cases” when they were, perhaps, ill with flu but happened to have some Covid-19 RNA in their noses?
Come to think of it, it would be nice and probably very helpful if the proper meanings of some other words were also restored. “Pandemic”, for example – which always meant a disease that spread worldwide and caused widespread serious illness and (probably) death. Until WHO redefined it to mean any disease that occurs worldwide (such as the common cold). Thus WHO has enabled officials to use the term “pandemic” to frighten the uninformed.
“A superior man, in regard to what he does not know, shows a cautious reserve. If names be not correct, language is not in accordance with the truth of things. If language be not in accordance with the truth of things, affairs cannot be carried on to success. When affairs cannot be carried on to success, proprieties and music do not flourish. When proprieties and music do not flourish, punishments will not be properly awarded. When punishments are not properly awarded, the people do not know how to move hand or foot. Therefore a superior man considers it necessary that the names he uses may be spoken appropriately, and also that what he speaks may be carried out appropriately. What the superior man requires is just that in his words there may be nothing incorrect”.
– (“The Rectification of Names”) Confucius, Analects, Book XIII, Chapter 3, verses 4-7, translated by James Legge
And now my punchline, Dr No.
The neighbour who shares a taxi ride to hospital for the jab is an FRS.
FRS?
Mike – Dr No presumed Fellow of the Royal Society. A very learned institution.
dearieme – next thing we’ll hear is they are sharing a taxi to visit Barnard Castle.
Helen and Tom – thank you for your contributions. This is indeed all about diagnosis, both of cases and pandemics, and the words and definitions of cases and pandemics used. Along with many others, Dr No is sure we all agree that one or more positive result from a dodgy test does not a case make, yet these tests (and ‘mentions’ on death certificates) are routinely used to define covid ‘cases’, ‘admissions’ and ‘deaths’. By coincidence, or perhaps not, Dr No was re-reading some George Orwell earlier today and came across this passage from 1984:
“Don’t you see that the whole aim of Newspeak is to narrow the range of thought? In the end we shall make thoughtcrime literally impossible, because there will be no words in which to express it. Every concept that can ever be needed, will be expressed by exactly one word, with its meaning rigidly defined and all its subsidiary meanings rubbed out and forgotten. Already, in the Eleventh Edition, we’re not far from that point.”
or, with a few minor changes:
“Don’t you see that the whole aim of covidspeak is to narrow the range of thought? In the end we shall make covidiocy and covid denial literally impossible, because there will be no words in which to express it. Every concept that can ever be needed, will be expressed by exactly one word, with its meaning rigidly defined and all its subsidiary meanings rubbed out and forgotten. Already, in the first week of January 2021, we’re not far from that point.”
And carrying on in the same vein, with again a few words changed:
“Even now, of course, there’s no reason or excuse for being a covidiot or covid denier. It’s merely a question of self-discipline, reality-control. But in the end there won’t be any need even for that. The Revolution will be complete when the language is perfect. Covidspeak is the New Normal, and the New Normal is Covidspeak.”
That’s why we see such froth and nonsense in MSM and on twitter this evening about today’s headline 1,041 deaths. To those who are already fluent in Covidspeak, history has already been written and rewritten, and the Revolution is already complete.
Those of us who have yet to become fluent in Covidspeak can remind ourselves that (a) these 1,041 deaths are “Deaths within 28 days of positive test by date reported“, and reporting will have been delayed over the recent bank holidays (b) eyeballing the corona dashboard chart shows today is high, but the moving average is much lower, at just under 700 deaths per day (c) we expect more deaths in January; instead of frothing about a single day, we need to wait until we can assess the excess deaths and (d) in line with what has been said earlier, many of these ‘covid’ deaths will not in fact be covid deaths, in any pre-Covidspeak meaning of the phrase.
Tomorrow should see the release of the latest bed occupancy figures. It will be interesting to see how they have changed.
Our local London hospital has 94% of it’s acute beds filled with patients who are being treated for COVID with a further 195 non-acute beds with COVID patients and 48% are under 65y old.
The inability of secondary care to do anything other than manage COVID for the foreseeable future appears from here at least to be a bigger problem than erroneous surveillance.
Jonathon – from your tweet reply (Dr No has cut back his twitter activity, so replying here instead): “Don’t you also need to be examining the hospital statistics to see how many beds are occupied by patients with COVID and how many are left for patients with any other kind of illness?” Dr No will see if he can integrate the daily and weekly occupancy stats to get a feel for what the covid load is. But that has to be with the caveat that there is almost certainly a lot of covid over diagnosis going on, perhaps all the more so as Covidspeak beds in deeper and deeper.
That’s a good idea. Perhaps you could help in ITU as well?
Jonathon – Hugh Squim, Fergus Squash and Nick Wriggle are all scurrilous reporters, as you well know from the HSCB days. Squash’s unprecedented access to one of London’s front line hospitals etc etc has some oddities eg first time Dr No has seen a theatre with windows in a very long time, plus if UCL are admitting pts from other hospitals, then they are not over-flowing with their own pts. Yes, UCL is a central London hospital, so not a standard catchment area, but all the same…
Let’s see what the occupancy figures reveal when they are published.