
Hot Stiff Bias Cools Off

Early on in the pandemic, Dr No coined the phrase hot stiff bias to describe the habit of doctors of the covid tendency to attribute any death that might, however vaguely, be due to covid, as being definitely due to covid. It is a covid specific form of the more general hot stuff bias, in which doctors tend to attribute illness and deaths to ‘hot’ diseases, the ones that are currently ‘hot’ topics. It is a practical expression of there’s a lot of it about, the old medical standby for when one doesn’t have a clue, but wants to sound as if one does. An easy concept to understand, hot stiff bias is typically hard to quantify, but the latest ONS data does gives us a clue. It seems that as the weather warms up, covid hot stiff bias cools off.
ONS’s weekly mortality reports include the number of deaths with covid (covid anywhere on the death certificate) and, of those, the number of deaths from covid (covid is recorded as the underlying cause of death). We might reasonably assume, bar any notable changes, which we shall come to shortly, that if the virulence, or lethality, of covid remains constant over the medium term, then the proportion of those who die with covid, who also die from covid, will also remain reasonably constant over the same term. Note that this proportion is not the same thing at all as the case fatality ratio, which is the proportion of all known cases who die. In this post we are only concerned with fatal cases with a diagnosis of covid, and the proportion of those fatal cases where covid is recorded as the underlying cause (mathematically, those who died from covid, divided by those who died with covid: if there were 100 deaths with covid, and 50 of those were deaths from covid, then the proportion is 0.5, or 50%).
It turns out that the proportion of deaths with covid that are also deaths from covid is not constant. Figure 1 shows the proportion for each week in 2021. From a peak in mid January of around 90%, the proportion steadily fell over the following weeks to around 75%, before somewhat levelling off in recent weeks.
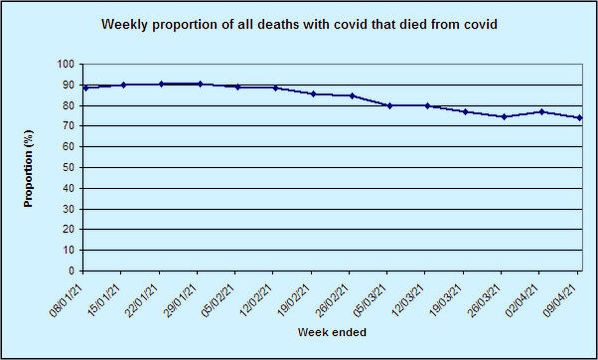
Figure 1: weekly proportion of all patients who died with covid who also died from covid, England and Wales, 2021 (source)
If the curve in Figure 1 looks familiar, it is. It is of course the peak and decline of a wave of covid deaths. This suggests that in each week, the proportion of deaths from covid might be correlated with the total number of deaths with covid. Figure 2 shows the scatter plot, with fitted trend line. The two clearly are correlated, and the high r value of 0.96 confirms this (r = 1, perfect correlation; r = 0, no correlation).
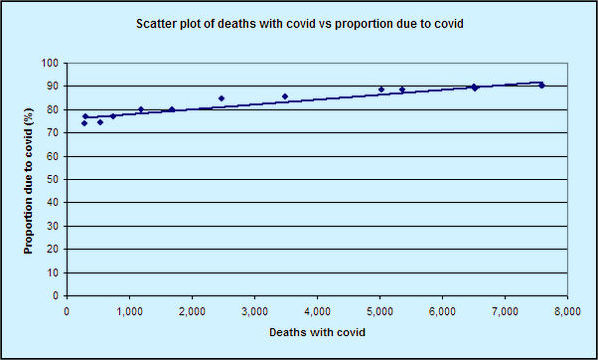
Figure 2: weekly scatter plot of all patients who died with covid against proportion of those deaths who died from covid England and Wales, 2021 (source)
There are three broad possibilities that might explain this decline in apparent virulence (lethality) in recent months: the virus got weaker (less virulent, highly unlikely over such a short time frame), patients got more resilient, either naturally, or through vaccination or treatment, or there is a bias at work, distorting the figures.
According to The Telegraph, who only yesterday soaked up a leaked report due to be presented to SAGE today, it’s the vaccine wot done it. But this is implausible. Look at the peak in Figure 1, and so when the fall in the proportion dying from covid starts. The fall starts in mid to late January, long before any plausible vaccine effect could appear (on 17th January, only 60% of those aged 80 and over had received their first dose, rising to 80% on 24th January, and the vaccine takes around three weeks to become effective). Moreover, the decline in the proportion dying from covid has levelled off in recent weeks, just as more people get vaccinated. Perhaps most compellingly, the decline in apparent virulence also happened after the spring 2020 wave, when the vaccines were but a twinkle in the eye. Figure 3 shows the weekly proportion of all patients who died with covid who also died from covid for the entire pandemic. Although the correlation is weaker (r = 0.59) because of some outliers, the same pattern is visible throughout: the proportion goes up in peaks, and drops in troughs.
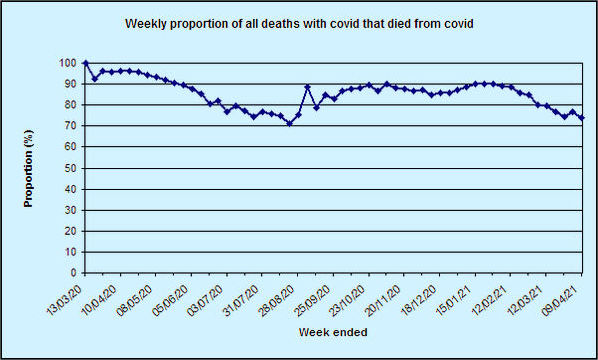
Figure 3: weekly proportion of all patients who died with covid who also died from covid, England and Wales, entire pandemic (source)
The data presented here does not prove that hot stiff bias applied during covid peaks. Correlation is not causation. But there is clearly something going on. In the absence of any other plausible explanations, Dr No suggests the most likely cause of these changes in apparent virulence are at least in part, if not entirely, due to hot stuff bias. When covid is ‘hot’ — there’s a lot of it about — doctors subconsciously become more likely to record covid as the underlying cause of death, and in so doing artificially inflate the apparent number of deaths due to covid.
BBC on whether benefits of Covid vaccine outweigh the risks.
https://www.bbc.co.uk/news/health-56620646
Is is me, or is there something deeply and deliberately scare-mongering about their maths?
“The seasonal flu jab has around a one-in-a-million chance of causing the nerve disorder Guillain-Barre syndrome. So, the real question is: Are the risks worth the benefits?
“Even if the vaccine was the cause, and this is still not proven, the numbers suggest around one death in every 2.5 million people vaccinated. However, this has to be weighed against the known threat posed by coronavirus.
“If 2.5 million 60-year-old people caught coronavirus then around 50,000 would die. If they were all 40-year-olds then around 2,500 would die.”
Dr No, I’m going off at a bit of a tangent here, but ONS started publishing details of ‘involving COVID-19’ and ‘due to COVID-19’, in comparison with similar figures for Influenza and Pneumonia, apparetly in an effort to answer the ‘with – of’ debate. These have featured in the Deaths Registered Weekly series for many months now. (See two graphs below – may need to scroll.)
Clearly the P&I category is almost entirely Pneumonia. In normal times, Influenza would only form a small percentage of P&I mentions but, over the past year, influenza has all but disappeared. Anyway, it is the pneumonia which really interests me here.
It can be seen that peaks in deaths ‘involving P&I’ align with peaks in deaths ‘due to COVID-19’. This is not very surprising because, after all, COVID-19 emerged as a new type of pneumonia, and WHO Death Certificate Guidelines show as an example a causal chain progressing from COVID-19 to Pneumonia to Acute respiratory distress syndrome.
What surprises me, but Dr No may well be able to explain, is that there appear to be so few cases of COVID-19 which ‘involve’ pneumonia. That is, if we note the ‘background’ levels of pneumonia visible before March 2020 and during the summer, the rises in mentions of pneumonia during the COVID peaks are really quite small.
Perhaps doctors treat COVID-19 as a form of pneumonia, so see recording of both as tautological? Or perhaps COVID-19 frequently leads to death from another cause without first inducing pneumonia? Surely COVID-19 would not appear as a lone cause, would it?
Can Dr No explain why so many deaths might be ‘due to COVID-19’ without ‘involving pneumonia’?
Apologies – I thought I’d managed to embed the graphs in the comment, but apparently not. The graphs in question appear here: Deaths registered weekly in England and Wales, provisional: week ending 9 April 2021 at Figure 2: The number of deaths involving COVID-19 decreased in Week 14.
I am worried that Dr No, like very many other commentators, seems to have fallen into the habit of accepting some propositions which I very much doubt.
1. That a diagnosis of “Covid-19” is ever reliable, except perhaps for a few extreme cases. PCR and LF tests do not seem at all reliable; even if they do detect some fragment(s) of RNA that might belong to SARS-CoV-2, there can be no certainty that these are disease-causing agents. Some such fragments, I understand, may be produced by the host human organism.
2. That a death certificate attributing death to “Covid-19” is ever reliable, except perhaps for a few extreme cases. Since the lurgy has virtually no unique signs and symptoms, and there is no reliable test, how can anyone tell that a person is suffering from Covid-19 rather than some other sickness?
3. That the vaccines do much to protect against infection or to prevent the vaccinated from being carriers. I have seen no trustworthy evidence that the vaccines do anything except, occasionally, to cause very nasty illness or even death.
Tish – “If 2.5 million 60-year-old people caught coronavirus then around 50,000 would die. If they were all 40-year-olds then around 2,500 would die.” It all depends on what the IFR (infection fatality rate) is, and no one really knows (and it isn’t fixed, either, depends on age and a host of other factors, comorbidities etc). You also need to know seroprevalence to calculate IFRs, adding a further layer of complication.
The IFRs used by the BBC here are 2% for 60 year olds and 0.1% for 40 year olds. Published estimates here (Table 2) and here (Fig 2.a) put the IFR at somewhere between 0.13% 0.75% for 60 year olds (wide range reflects difficulty in making the estimate), so the BBC appears to have over-egged the pudding for 60 year olds, and somewhere between 0.014 and 0.13% for 40 year olds, so the BBC might be in the right ball park here. Using mid-estimates from these published IFRs, we get 11,000 deaths for 60 year olds, and 1,800 deaths for 40 year olds.
The BBC haven’t provided the source for their IFR estimates, so we can’t assess their veracity, but their general point that, on what we know so far, the risk of death from covid is orders of magnitude greater than the risk of serious side effects/death from the vaccine still stands. However, it is also probably true to say that most people view a death from a medical intervention as something very different from a death due to a disease. It remains, as ever, for the individual to decide how to weigh those risks.
Misa – good points, and yes, there is a lot of smoke and mirrors. Even ONS terminology changes a bit from time to time: ‘mentions’ are synonymous with ‘involving’, and both are the same as ‘with’, and there is the subset of ‘with’ who died ‘from’ (‘due to’).
The key things relevant to your questions here are (1) how doctors record deaths on the certificate, in particular, the chain of events, and then (2) how ONS interpret, and so register, those entries. Unfortunately, we are unlikely to see a set of actual MCCDs, and then the workings ONS used to convert those registrations in registered causes of death, and so the matter remains opaque. Dr No’s Ode to the Death Certificate post considered some of factors (and made a horrible attribution error in the final sentence, it’s Keats not Wordsworth), and the general drift appears to be an attempt to make covid the underlying cause of death whenever possible. This quote from the WHO guidelines is pertinent (emphasis added):
“With reference to section 4.2.3 of volume 2 of ICD-10, the purpose of mortality classification (coding) is to produce the most useful cause of death statistics possible. Thus, whether a sequence is listed as ‘rejected’ or ‘accepted’ may reflect interests of importance for public health rather than what is acceptable from a purely medical point of view. Therefore, always apply these instructions, whether they can be considered medically correct or not. Individual countries should not correct what is assumed to be an error, since changes at the national level will lead to data that are less comparable to data from other countries, and thus less useful for analysis.
“A manual plausibility check is recommended for certificates where COVID-19 is reported, in particular for certificates where COVID-19 was reported but not selected as the underlying cause of death for statistical tabulation.”
The last paragraph is interesting: it seems to offer a last ditch chance to grab covid as the underlying cause of death when such an opportunity has previously been missed.
“Perhaps doctors treat COVID-19 as a form of pneumonia, so see recording of both as tautological? Or perhaps COVID-19 frequently leads to death from another cause without first inducing pneumonia? Surely COVID-19 would not appear as a lone cause, would it?” It is certainly possible that doctors completing MCCDs could consider severe covid in a patient who then died of covid as ‘obviously’ a pneumonia, and so no need to record pneumonia as well. At the same time, the direct cause of death (entry 1(a) on the MCCD) might well be complications arising from covid – organ/system failure (including lung/respiratory failure, including ARDS), septic shock, whatever. This rather confusing table from a study in a specialist unit gives a list of possible candidates.
The bottom line is that the process of certifying and then coding cause of death during the pandemic is far murkier than it should be. Reading between the lines of what is available, it appears WHO prefer ‘useful’ statistics to ‘medically correct’ statistics. We can make of that what we will…
Tom – no need to worry that Dr No has gone over to the dark side – see above. Furthermore, this post is just about the observation that the proportion of cases with covid who also die from covid rises when covid is ‘hot’ ie during peaks, and whether hot stuff bias might be the explanation. That doesn’t mean Dr No accepts that all the non-hot stuff bias alleged deaths due to covid are true deaths due to covid. Hot stuff bias might operate continuously (only we can’t see it for lack of data), and then boil over (and so become visible) during peaks. Or there might be any other number of biases at work, including the WHO better to have useful rather than accurate stats bias discussed above. It really is the most remarkable statement: better to have public health propaganda rather than medical facts.
The manual plausibility check is a nice touch. Anything still not being assigned to an underlying cause of COVID-19 after this is pretty clearly a ‘with’.
If I have understood you correctly on mentions of pneumonia, it is not necessarily strange that a clear majority of deaths ‘due to COVID-19’ do not mention pneumonia. Many thanks for that.
Dr No: you should include another category alongside dying ‘from’ or ‘with’ CoVid, that is dying ‘for’ CoVid. All those brave individuals who have selflessly given up their lives by foregoing hospital treatment so CoVid could have their beds.
News from the Western Front. I knowFrance is not in Dr No’s bailiwick but the data there touches on the question about what is the exact number who died of CoVid.
In France deaths in the soi-disant 2ème Vague peaked around 25 November then declined gracefully into the first few days of January when there was a slight upturn which peaked in first week of February, then has remained more or less level, if reporting delays are evened out, until mid-April when it looks like there might be a slight decline. No other Country has this profile.
During the whole of this time we have had various restriction – ubiquitous masks – curfews, localised lockdowns then since start of April until 02 May (supposedly) general lockdown-sort-of. This was to avoid the 3ème Vague which no data indicated was imminent.
Yes we know restrictions have no effect, and if we didn’t know certainly the data shows that to be so quite clearly, but even so France seems to have had a near constant daily death rate for months. It tempts one to suppose nearly every death is being labelled CoVid and nobody dies from anything else.
On the other hand, maybe France is the only Country which has succeeded in ‘flattening the curve’ – at the second attempt: last year just a practice run maybe.
EUROMOMO shows France all-cause deaths in line with ‘flu season in previous years, except 2019/2020 which was low.
Misa – yes, you have understood Dr No’s interpretation correctly. But it is still a muddy area. The UK guidance for completing death certificates ‘during the emergency period only’ gives this example (and only this example) of a ‘correctly’ filled in cause of death, with covid-19 as the underlying cause, which frankly makes no sense:
According to the traditional rule, I(c) leads to I(b) which leads to I(a) – a chain that makes no sense in this example. How on earth does colon cancer lead to covid-19? No doubt the ‘manual plausibility check’ comes in helpful here: the colon cancer entry gets ignored, and covid trumps it to become the underlying cause of death. Perhaps the colon cancer entry should be listed under II Other significant conditions Contributing to death. Who knows (and that’s the problem…)?
The example also illuminates the ‘missing pneumonia’ question. Strictly speaking, (interstitial) pneumonitis is a general term meaning (interstitial) inflammation of the lungs (pneumono + itis, where ‘itis’ means inflammation, hence meningitis, appendicitis etc), and generally pneumonia is pneumonitis caused by infection, so if covid-19 I(b) lead to interstitial pneumonitis I(a), then the pneumonitis is a pneumonia… But then again, pneumonitis is often used to indicate a non-infectious cause, in which case I(b) can’t have led to I(a), and covid is not only not the underlying cause of death, it is irrelevant to the cause of death… If this all appears rather confusing, it is because it is all rather confusing, and so in turn we don’t really know how many people really die from covid. All we can glean from the official guidance is that this nonsensical example will nonetheless end up with covid-19 as the underlying cause of death…
John B – Dr No thinks it is very fitting to recognise all those who have nobly and bravely died for covid with their very own category. It recognises their very special contribution in the war against covid. The pandemic trajectory in France is indeed baffling. To make things even more baffling, here is OWID’s chart for France Spain and Italy. All large European countries, all flank the Mediterranean… and in the second wave(s), all over the place!
I just wonder whether the colon cancer is simply a typo (or copy/paste error) as it appears across two lines in the middle of description:
(c) other disease or condition,
if any, leading to 1(b)
Perhaps 1(c) was meant to be blank.
Misa – you are very charitable. The thing is, this is official guidance, and it has a direct bearing on the estimated size of the epidemic. We all make errors, but errors in such a critical document should not remain uncorrected. Unless, that is…obfuscation and confusion are the order of the day.
Too charitable, perhaps. But it does appear that the same underlying cause was present in the first example MCCD of the pre-COVID guidelines, and that this example was shunted into second place for the emergency guidelines.
I’ve dropped a note to the ONS asking for confirmation and correction. I will let you know when/if I hear back from them.
Misa – good forensic work! What is interesting is that they have used such a confusing example. “Cause of death the disease or condition thought to be the underlying cause should appear in the lowest completed line of part I” and then they say that the middle entry ie I(b) COVIC-19 is the underlying cause of death. A far better example, if they wanted to show covid as an underling cause would be something like this modified (to add the colon cancer) WHO example (which coincidentally includes pneumonia):
I(a): Adult Respiratory Distress Syndrome
I(b): Pneumonia
I(c): Covid-19
II: Primary adenocarcinoma of ascending colon
It may be the UK guidelines are either deliberately or subconsciously demonstrating the way covid will trump other diagnoses.
The bottom line still remains these working practices are extremely likely to cause covid to be over-represented as the underlying cause of death. Or as WHO have it, produce ‘useful’ public health stats, rather than medically accurate causes of deaths. This still remains one of the most eye-popping admissions of all: why let facts get in the way when you have got a pandemic to nurture?
It will be interesting to hear if ONS reply to your note, and if they do, what they have to say.
Dr No, I thought you might enjoy this article on the recording of COVID-19 deaths in the US. No great surprises for you, I’m sure, but perhaps interesting to see discussion of the issue from an American point of view. You’ll find links to guidelines similar to those for the UK.
After writing to ONS last Saturday, I receievd an automated response saying that they aim to repond within 10 working days – i.e. by 10 May. I will let you know when I hear from them.
Misa – an interesting article, and yes, Dr No agrees with the main points. Worth reading.
My note to ONS brought the following response:
This example is stating that the person had cancer which led to COVID-19, interstitial pneumonitis then death.
There are examples where this could be true. It could be that the deceased’s immune system was compromised due to the cancer which led to COVID, interstitial pneumonitis then death or the deceased’s cancer led to hospitalisation where they then caused COVID, interstitial pneumonitis then death.
Hope this helps
I’ll be interested to hear what Dr No makes of this, but my initial thoughts:
1) Saying ‘this could be true’ is not quite be a denial that it was a mistake. Given that the full text in the example for Part 1(c) reads ‘other disease or condition, primary adenocarcinoma of ascending colon if any, leading to I(b)’ it would appear clear that there was indeed a mistake.
2) If the ‘deceased’s immune system was compromised’ this is more interesting. The WHO International Guidelines for coding COVID-19 (Section 3.D Comorbidities) seem quite clear:
There is increasing evidence that people with existing chronic conditions or compromised immune systems due to disability are at higher risk of death due to COVID-19. Chronic conditions may be non-communicable diseases such as coronary artery disease, chronic obstructive pulmonary disease (COPD), and diabetes or disabilities. If the decedent had existing chronic conditions, such as these, they should be reported in Part 2 of the medical certificate of cause of death.
However, this seems less clear in the ONS guidelines and Section 5.4 simply states:
Remember to specify any underlying disease that may have suppressed the patient’s immunity or made them more susceptible to the infection that led to the death.
It appears that, in some situations, an underlying disease that may have suppressed the patient’s immunity could, according to ONS guidelines, be noted in part 1 of the MCCD. Guidelines suggest that conditions which make the patient susceptible to pneumonia, for example, should be noted in part 1. I’m less clear that this would apply for an ordinary infection which anyone may (apparently) easily contract, like influenza, or COVID-19.
3) If ‘cancer led to hospitalisation where they then caused COVID’ this would presumably be a hospital acquired infection, which is covered by the guidelines (Section 5.4.1. Health care associated infections):
If a health care associated infection was part of the sequence leading to death, it should be in part I of the certificate, and you should include all the conditions in the sequence of events back to the original disease being treated.
An example shows ‘Ia.bronchopneumonia (hospital acquired Meticillin Resistant Staph aureus)’.
Section 5.4 states that the source of the infection, if known, should be stated, as we see in the example above. But, unless the infection was thought to be hospital acquired, the disease which caused the trip to hospital ought not be in part 1, right?
Misa – thanks for the ONS response. If anything, it seems to muddy the waters! With some italics and other additions:
“This example is stating that the person had cancer which led to COVID-19, [which led to] interstitial pneumonitis [which] then [led to] death.
There are examples where this could be true. It could be that the deceased’s immune system was compromised due to the cancer which led to COVID, interstitial pneumonitis then death or the deceased’s cancer led to hospitalisation where they then caused [sic, perhaps a typo for caught] COVID, [which then led to] interstitial pneumonitis then death.”
The first paragraph is a clear I(c) led to I(b) led to I(a) statement, and so I(c) the cancer is the UCOD (underlying cause of death). The second paragraph provides possible coupling mechanisms (as Dr No said earlier, cancer can’t directly in and of itself cause covid, but it might, by these mechanisms, lead to covid).
A large part of the problem seems to lie with semantics: the meanings of the verbs lead to, cause and contribute to. Do lead to and cause have the same meaning? Probably not: in parallel with the sins of omission and commission, lead to might cause because something didn’t happen (immune system didn’t do it’s job) whereas cause implies a positive causation. Lead to is looser: A can lead to B without having to directly cause B. And the key thing is the MCCD uses the verb lead, so the looser connection is sufficient. This is also consistent with the train/sequence of events notion that runs through the MCCD guidance: connection is sufficient, even if there isn’t direct causation. So again, in the ONS email example, cancer is the UCOD.
Only it isn’t, because of the WHO/ONS trumping rules. Diseases, typically infectious, considered of public health importance, are not only allowed, but explicitly required, to trump any other potential UCOD.
“[U]nless the infection was thought to be hospital acquired, the disease which caused the trip to hospital ought not be in part 1”: whether disease X should be in Part 1 (or 2) will depend on doctor’s ‘best judgement’ of the train of events. If we adopt the loose ‘lead to’ formulation with the train for example being cancer => compromised immunity => covid => death from covid complications and the patient is in hospital (for whatever initial reason, which might be the cancer rather than covid), then it seems reasonable to include the cancer in Part 1. The key point here is the train of events, not where it happens, or the mechanism by which it happened.
But ONS will still have covid trump cancer as the UCOD…
I’m just not sure what to make of it all, Dr No, except to say that it appears to be a very poor and hastily prepared example. It seems ONS cares little anyway, and this irks me. It must have been a typo, and arguing that it could sometimes in some situations be not necessarily wrong, does not seem becoming of HM Gov.
Yes, selection rules will ensure that most mentions of COVID-19 end up with it being selected as underlying cause anyway. It’s quite staggering for someone who had not examined these things until last year to realise how little useful information may be extracted from mortality records, and how much misguided policy must be based on such. Lordy.
Misa – yes, a bit of an eye opener all round. Part of the problem is that MCCDs are just paperwork to most doctors, with no reward/feedback, and there’s a underlying wish not to ruffle official and relatives’ feathers which may be another factor increasing the chances of covid appearing as a cause of death, and so, because of the ONS coding rules, becoming the UCOD. Traditionally, the coding of heath data, especially hospital episode stats, but also other health data including deaths, has regrettably been seen as a low status job, and that has an inevitable effect on recruitment. Nonetheless, it is disconcerting to see evidence of sloppiness first hand.
We also have to remember that today’s cause of deaths stats are not always objective records of true cause of death. Our public health goons are not above using them as a tool to highlight what they decide are the important and amenable to intervention threats to public health. We see this very clearly in the way covid (and certain other infectious diseases) always trump other causes as the UCOD, with the rationale for this in plain sight in the coding of cause of death documents. This must almost inevitably cause a bias that increases the apparent number of deaths where covid is the UCOD.
Thanks for all you’ve done to help me understand, Doc! I wonder whether you think it would be worth the effort for me to try to press ONS further on their response? (i.e. come on chaps, why not just admit it was a typo and correct it?)
On the broader issue of death stats, coding, and UOCD selection, I think the effect of the Diagnostic and Statistical Manual of Mental Disorders has rightly been criticised for (many reasons, not least) the distortions it causes. What I’ve seen, over the past year, of the International Classification of Diseases suggests to me that it too may well be creating all kinds of distortions, leading to some very strange policy making, yet I’ve not encountered any serious criticism of it.
Misa – a pleasure. No harm in continuing to press ONS to tighten up their ship.
DSM-V is infamous for manufacturing new psychiatric conditions, and converting unusual and/or unfortunate but still normal behaviour into new diseases which of course need treatment, and treatment means $$$…
ICD-10 on the other hand is generally a bit more robust, at least for straightforward physical diseases, though there are some pretty bizarre entries. Many of its problems are not inherent to it, but in the way it is used, from coding MCCDs which themselves vary greatly in data quality, through setting up hot diagnoses that trump others (as in covid), to selective extraction of data. It’s yet another case of lies, lies, and then statistics.
But we shouldn’t throw the baby out with the bath water – it is still worth looking at the stats, but with the obvious caveats firmly in mind.
I’m sure there was a paper I came across that discussed stats (and so implication ICD) being used to distort, or accidentally distorting, public health priorities, but I can’t lay my hands on it right now. If I find it, it’ll probably generate a post!