
Safetyism
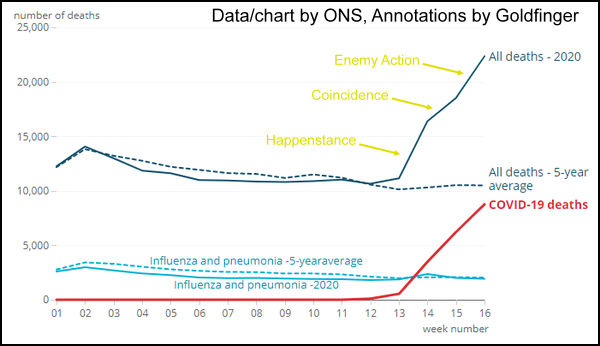
Happenstance, coincidence and enemy action, the doctrine of three developed by Dr No’s colleague Goldfinger, is as good a guard as any against the risk of over-reacting to chance events. The time to sit up take notice is when something exceptional has happened not once, but three times in a row. The ONS has now reported exceptional rises in the weekly number of all cause deaths in England and Wales for three weeks in a row. It is time to sit up, take notice, and ask, what is going on?
As ever, we must guard against a rush to hysteria. So the first question to ask is, are the data reliable, and a true reflection of what is going on? The answer, wacky conspiracy theories aside, is yes, because the data are for all cause mortality, and as previously noted, all cause mortality is as good as it gets when it comes to epidemiological data. When the bell tolleth, it tolleth with certainty. Although a crude number, it is unfudged by confusions over the cause of death, so much so that its crudeness becomes an asset. The fact the rise has now been sustained for three weeks in a row also means we can most likely — most likely, because only in the future will we know for certain — rule out the rather gruesome low hanging fruit hypothesis, in which the grim reaper reaps a bounty of extra deaths in the early stages of an epidemic by taking the most vulnerable, the low hanging fruit, soon after he starts his grim work.
Once we are certain the data reflect reality, that there really are notably more people dying than normal, we turn to ask the question, what is causing these exceptional numbers of deaths? Naturally, during a pandemic, we look first at the pandemic to see if it explains the excess deaths. What we find is that it almost certainly explains some of them, but equally it does not, by a long measure, explain all of them.
For the last weeks, the ONS has also reported the number of deaths where covid-19 has been mentioned anywhere on the death certificate. A mere mention is sufficient to get counted, so some of these deaths will be deaths with, rather than deaths from, covid-19, and this will introduce a bias — technically, a systematic error — that overplays the significance of covid-19 in causing the excess deaths. Add to this hot stiff bias, previously discussed, in which there is a tendency for a ‘hot’, as in ‘of the moment’, cause of death to be over-enthusiastically applied, and we can be as reasonably sure as we can be, that any count of covid-19 deaths will exaggerate the importance of covid-19 in causing those deaths.
For the latest reported week, the week ending 17th April, 22,351 deaths were registered, with that number being 11,854 more deaths than the average number in the same week over the last five years. Give or take a few, this is twice the number of deaths we would expect. And yet, the total number of deaths registered with covid-19 mentioned anywhere on the certificate, which, for the reasons noted above, will over-attribute deaths to covid-19, is only 8,758. That means there are at least three thousand, possibly many more, excess deaths in which covid-19 played no part.
This is the number that should concern us most. Tragic as they are, the brutal fact is that covid-19 deaths are to be expected in covid-19 pandemic (though of course we still want that number to be as small as possible). What we should not expect, let alone see, is several thousands of weekly excess deaths that are prima facie not caused, at least directly, by covid-19. If tragedy can be doubled, these are the doubly tragic deaths.
Doubly tragic, in the sense that they may have been caused by the very measures intended to control the harms and deaths caused by covid-19. The modern culture of safetyism, so present during this pandemic in the ‘stay home, stay safe’ message, can all too easily blowback, and aggravate that which it is intended to alleviate.
National lockdown is a blunt, intensely heavy-handed and crude approach to managing pandemics. If not quite the proverbial sledgehammer to crack what is certainly a large and tough coconut, it is certainly a lead blanket. It stifles the economy, and poverty causes death. It suffocates hope, and loss of hope is the defining feature of depression, and depression causes deaths. It stresses already stressed families, and where there is incipient domestic abuse, it can cause overt abuse, and domestic abuse causes deaths. By its weight, it sedates, and we do not seek medical help when normally we would, and not getting treatment for life threatening conditions causes deaths. Even worse, many of the damaging effects are persistent, and linger long after lockdown is lifted. Many of these deaths are preventable, by the simple measure of avoiding the crude, blunt and unfocused measure of national lockdown, and replacing it with redoubled focused protection where it is most needed.
That such an approach can work is very strongly suggested by comparing Scotland’s (hard lockdown) and Sweden’s (soft lockdown) covid-19 deaths. Dr No’s method is simplistic (a simple adjustment that shows an adjusted number of deaths for Scotland were it to have the same population as Sweden), and no doubt misses many subtler factors that should be adjusted for, including age distribution, which would suggest Sweden should have a higher number of deaths, given it has an older population. These concerns aside, the starling finding is how remarkably similar the two countries numbers of deaths are. Here is the updated chart, to 27th April 2020:
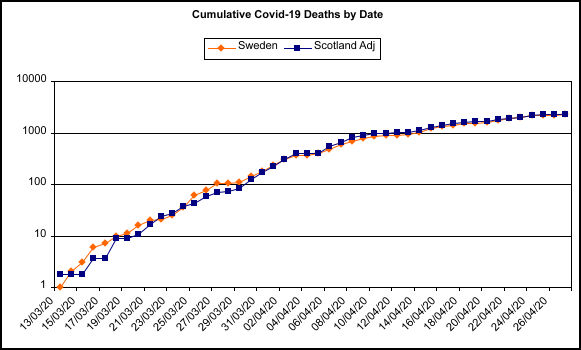
Figure 1: Cumulative covid-19 deaths by date for Sweden and Scotland, after adjustment for population size. Deaths plotted on a log scale, which transforms exponential curves into something closer to straight lines, and makes them easier to compare. Data sources: Sweden: JHU Scotland: Scottish Government via Wikipedia.*
As doctors, we are taught to be wary of anecdotal (n=1) studies. We must hope that our Prime Minister’s recent close encounter with covid-19 (n=1) does not unduly influence his decision making on when, where and how to ease the lockdown.
* Footnote added 29th April 2020 on the comparability of Swedish and Scottish data (the apples and oranges question): the data used for the chart from both countries is the ‘of those who tested positive, XXX died’ data, and not the invariably higher ‘covid mention on the death certificate’ data. So, for example, for 28th April, with the multiply by 1.8 uplift to adjust fro Scotland’s smaller population, we have:
| All tests | +ve tests | +ve & died | |
| Sweden | >94,600** | 19,261 | 2,355 |
| Scotland (adj) | 92,698 | 19,297 | 2,397 |
** Exact current number not reported, this figure is from mid April