
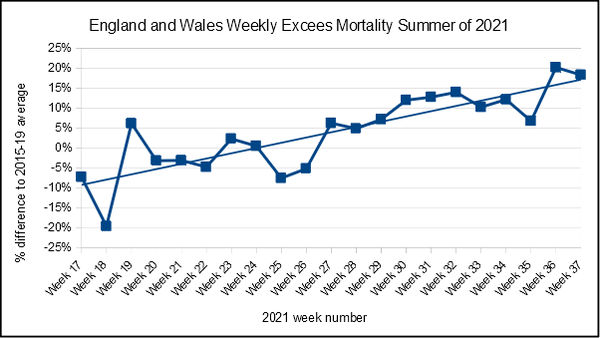
Byzantine formulas unfathomable by man, stretching out beyond five miles of fetid ground, and down to a sunless sea — all very well, but sometimes the simpler analysis better does our pleasure guarantee. The human brain is smarter at spotting a trend in a chart than in a table, and the chart at the top of this post tracks the weekly all cause mortality over the summer, expressed as a percentage difference compared to the average mortality over 2015 to 2019 for the same week, with an added trend line, using ONS data. Anything above the 0% line is excess mortality, and we can see at a glance things are not going well. In fact, we shall all likely be dead pretty soon, if the trend in recent weeks continues. What on earth is going on?


