
On Having One’s Hat and Eating It

Dr No is surprised. Today’s ONS England and Wales weekly mortality report does not show the fall in deaths he confidently predicted in his last post. The rate of increase has certainly slowed, but there is no gainsaying the fact that the total number of deaths registered in England and Wales in week 2, 2021 has gone up compared to week 1, 2021. Wales did in fact show a slight fall of 28 deaths, but England’s 318 extra deaths meant an overall rise. This is against a backdrop of both Scotland and Northern Ireland reporting recent falls in the number of weekly deaths. Nonetheless, England and Wales, or rather England, deaths did rise, and a rise is not a fall. Is part or all of Dr No’s hat destined for the slow cooker?
Here are the latest charts from the four nations, showing weekly all cause mortality and the recent five year average. Dr No has pointed out earlier that this is a loaded, or rather unloaded, benchmark, given that it is a brief snapshot of a period when mortality was at a historical low. Nonetheless, it has some use as a guess of where we might have been, all other things being equal, so Dr No has left the lines on the charts. All are by date of registration, not death. Sources are in the captions.
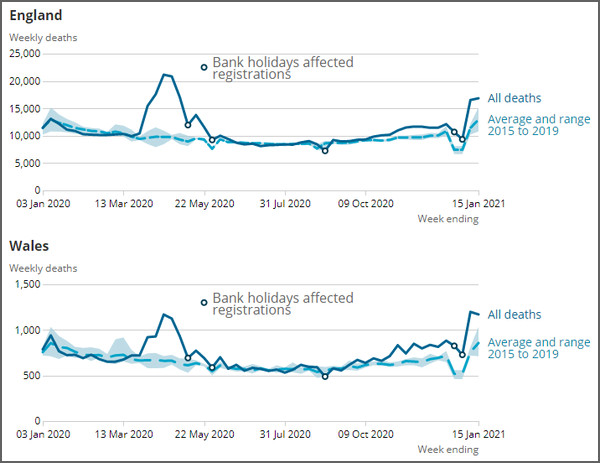
Figure 1: England and Wales all cause weekly mortality up to week ending 15th January. Source: ONS
Figure 2: Scotland all cause weekly mortality up to week beginning 11th January. Source: Scottish Government
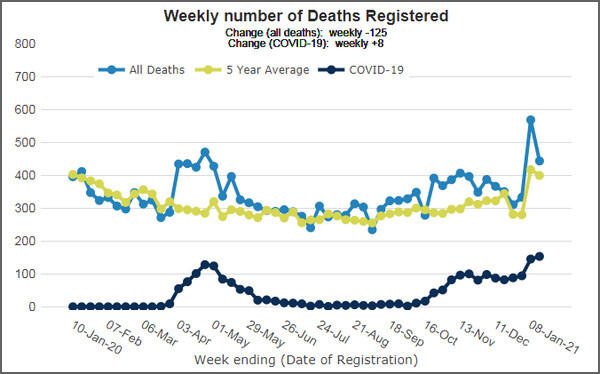
Figure 3: Northern Ireland all cause weekly mortality up to week ending 15th January. Source: NISRA
England is the odd one out. All three other nations show falls in registered deaths, with sharp falls in Scotland and Northern Ireland, with deaths either below or just above the five year average, yet England shows a small rise. One possible explanation, age of the population, with England having an older population, is unlikely, as all four nations have similar population age distributions for older age groups. As this is all cause mortality, there can be no underlying explanation based on attribution of cause of deaths. Size of population might be a factor, with smaller nations having greater week on week volatility, but that would imply randomness, one nation goes up, another goes down, when in fact all three nations with falling death rates started the fall at the same time.
‘When you have eliminated the impossible, whatever remains, however improbable, must be the truth,’ said Sherlock Holmes. Mindful of the Holmesian fallacy — that we may not have considered all the possibilities, let alone eliminated them as being impossible — it appears there was a rise in all cause mortality during January. If we apply Dr NoNo’s EuroMOMO styled de-bank holiday transformation, according to a method described by Dr No in a recent post, we end up with Figure 4.
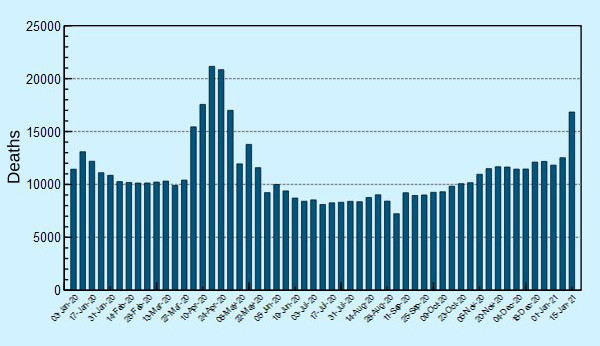
Figure 4: England (only) weekly all cause mortality up to week ending 15th January, with Dr No’s bank holiday transformation: subtract 4,000 from week 1 2021, and add back, 2,500 to week 53 2020 and 1,500 to week 52 2020. Source (for unadjusted data): ONS
The rise is still there, obviously, though perhaps minimally less stark as it is not preceded by two weeks of low counts. Tempted as he might be to flatten the spike — the Dr NoNo transformation applied additionally to week 2 2021 flattens and displaces it somewhat — considers that to be a venture into the realms of excessive speculation. The English week 2 2021 spike, seen against both recent English numbers, and other nations current trends, is an outlier, and only time will tell if it remains an outlier, or whether it is part of — Dr No is going to use the word — an exceptional peak in deaths. Perhaps most of all this is a reminder that just as daily counts always show wild variations, so too can weekly counts be subject to short term influences. Monthly or seasonal counts iron out daily and weekly fluctuations, but reveal seasonal patterns, and annual rates iron things out even further. It may not be easy, but we should not jump to snap conclusions based on one or two weeks worth of observations.
Dr No thinks he should eat a bit of his hat, but keep the rest for later, hopefully to wear, if not to eat…
A peak in week two is quite normal in the ONS stats.
2021 compared to trend
Respect to you Dr No!
You made a reasonable and reasoned prediction. It did not come to pass and you have highlighted the fact, perhaps in an attempt to learn from it.
Why don’t our highly paid, powerful masters & their ‘advisors’ do the same?
Nah. “Keep ’em frightened”, that’s the plan.
typo: “total number of deaths registered in England and Wales in week 2, 2021 has gone up compared to week 1, 2021”
Do delete comment.
djc – Dr No agrees (and thanks for the linked plot), with registration delays due to Bank Holidays plus typically a seasonal increase, and this is why Dr No hasn’t come out and said this is definitely a and exceptional spike. It also highlights again the problem of using short time frames like days and weeks, because there is inherently more volatility.
One of the first projects Dr No got involved in in epidemiology was one to determine when a background level of an infectious disease had risen enough to mean it was out of the ordinary, and so an epidemic that needed an out of the ordinary response. He and his colleagues back then concluded, Dr No is sure you won’t be surprised to hear, that there was no easy answer. The underlying problem is trying to detect a weak signal against significant background noise. Its exactly the same problem now, as we look at late 2020/early 2021: how much of what we see is background noise, with some of that amplified by external events, like bank holidays, and how much is a signal that something out of the ordinary is going on? On top of all this is the need for timeliness. With hindsight we usually have 20:20 vision, but as things unfold at the time, we are like walkers in the fog, unsure whether the gentle rise in gradient under foot is from the foothills of mountains ahead, or the hump of a sand dune leading to the beach.
DevonshireDozer – thank you. Dr No is reminded of his ‘better a good enough answer to the right question than an exact answer to the wrong question’ (with is this an exceptional rise being the right question, to which we don’t yet have a definite answer), and so on to the far more profound and insightful remark attributed (meaning we don’t know whether he said it, so in a way it even references itself) to Richard Feynman “I would rather have questions that can’t be answered than answers that can’t be questioned.” Whoever said it, thus spake the true scientist.
dearieme – the ‘typo’ is correct, the confusion, which Dr No has himself been caught up in in past posts, comes from ONS’s tiresome habit of constantly switching between ‘England’ and ‘England and Wales’. You really really have to watch your data table headings and individual column headings, especially when the same data appears in two places in different formats, and you need both to get the full picture.
The data for week 2 2021 dataset (publishedweek022021.xls) reports weeks 1 and 2 total deaths for England and Wales (with no by nation breakdown) as 17,751 and 18,042, which is a (small) increase. The ‘data download‘ for Figure 1 on the weekly report page reports the numbers by nation for weeks 1 and 2 2021 as 16,527 and 16,845 for England (so a rise of 318) and 1,198 and 1,170 for Wales (so a small fall of 28). Perhaps unsurprisingly these weekly totals (17,725 and 18,015) don’t match the totals in the other table – they are after all provisional – but they do still show a small week 1 to week 2 2021 rise, with the English rise outweighing the Welsh fall.
Dr No, on the subject of detecting when the level of a disease is out of the ordinary, did you look at the methodology of Statistical Process Control? This originated in manufacturing but is applicable to other areas. e.g. when I worked in the NHS we used it to monitor various aspects of the hospitals operational processes, e.g. A&E wait time, length of stay.
https://en.wikipedia.org/wiki/Statistical_process_control
The graphs above show a bump in the first part of January 2020 too, which strengthens the post-holiday reporting catch-up suggestion.
If it is true that more deaths are occurring from untreated non-CoVid diseases, shouldn’t we expect to see an increase in all-cause mortality by now, even if some of those deaths are being attributed to CoVid?
If CoVid is the name for the disease causing deaths associated with SARS CoV 2 virus, don’t we need a name for the deaths caused by Government policy. I offer StuPid (Stupefying Politician Idiocy Disease) but others may be more inventive.
Dr No could then plot CoVid deaths v StuPid over the next two years which lay add context.
“I offer StuPid (Stupefying Politician Idiocy Disease)…”
Nice – and quite ingenious – but simpler is “Govid”.
On the one hand we have a virus (perhaps) which causes disease (perhaps) but about which we know astonishingly little.
On the other hand we have government interventions unprecedented in… well, come to think of it, just unprecedented. In the aftermath of the English Civil War in the 17th century, many people were obliged (if they knew what was good for them) to attend church services and prayer meetings that lasted for as much as 7-8 hours; but they were free to do as they wished with what remained of their time.
In the days of the Angles, Saxons, Jutes, Danes and assorted other Norsemen – which would be at least 1,000 years ago – armies and smaller bands roamed the land arbitrarily killing anyone they chose, and taking over their property. But even then people were free to flee or move temporarily to a safer place.
So the government oppression that descended on us all last March and has continued ever since has literally no precedent. Whereas a fairly average viral respiratory disease has many, many precedents – we have lived with hundreds or thousands of them since our species emerged over 1 million years ago.
Which is then more likely to be responsible for “excess deaths” and illness: the run-of-the-mill virus (which, I understand, has never been isolated in pure form, which has no unique signs or symptoms, and for which there is no reliable diagnostic test); or the official diktats that have utterly disrupted daily life and are apparently intended to destroy the economy?
Last summer I had already concluded that Boris Johnson will go down in history as having done more harm to Britain than Adolf Hitler or Napoleon Bonaparte. That belief becomes stronger with every passing day. The only question in my mind is whether the harm was deliberate, or the result of incompetence.
But the mind boggles to contemplate either such malice or such stupidity.
John B – Dr No has already looked into effects on non-covid mortality which are unsurprisingly complex and the data is scarce (and the core data, mortality by cause of death over convenient time periods will take a while to appear). There are some proxies that might be ‘good enough’ for now. Interpreting the data is even more complex and Dr No has read, again unsurprisingly, interpretations of the scant data that come to opposite conclusions. Consider for example the virtual disappearance of flu. It could be (a) masks (and other NPIs) work for flu (b) the viral ecosystem/predator narrative, with covid being the new hyena on the respiratory tract mucosal plains ie a biological thing (c) hot stuff bias – flu misdiagnosed as covid, ie human all too human activity (d) etc etc or (e) any or all of these!
StuPid is definitely a step in the right direction for a name but PID is pelvic inflammatory disease at least for this ex O&G a long time ago doctor. Govid certainly works, and has extra meanings that can be read into it…
Tom – until someone proves the Martians have landed (lunatics running the asylum isn’t enough, that’s already happened), Dr No accepts the virus exists, and it causes a viral respiratory illness of varying severity with on occasion complications. CDC for example say they have cultured strains which they can make available, and there are non-CDC published papers that report viral isolation (pdf version is easier to read, link on the page). There is a true gold standard test, viral culture, but some goons somewhere along the way decided no need to bother with all that sort of nonsense round here, PCR tests are fine, and the PCR became (wrongly) the de facto gold standard. Then along came lateral flow tests, and no need to bother with that PCR test nonsense round here, lateral flow tests are the way to go. And so on…
A proper disease has (a) a set of symptoms and signs (sometimes overlapping other diseases closely) that cause dis-ease plus or minus lab/other test eg XR histology etc diagnosis and (b) a biologically plausible cause (which of course is strictly applied puts most of psychiatry in the bin, so sometimes we are a bit lax, but we should never let down our guard against fraudsters getting through the gate). SARS-CoV-2 does pass these tests well enough, if not perfectly.
The madness is not imagining a disease that doesn’t exist, it is in the utterly bizarre reaction to it, with it being just another virus of varying virulence of so many that have as you say been around since Homo not so sapiens of late first appeared (and of course were around for other species before then). In many ways it’s a classic ignoring of Dennis Healey’s first law of holes, only with dire national and global consequences, rather than consequences for one individual. Dr No has long been of the view that we have to find a way to live with the virus, even if that means some people dying (and in that it is no different to any other disease that kills, yet we don’t get in such a parlous state over TB, malaria or any number of other killers) without killing the arts, social intercourse, society, livelihoods and the economy in the process; and all the more so, since it is the first three of these that (among other things) make life worth living. By focusing so hard and exclusively on preventing covid spread, and so we hope deaths, we risk making one of the the oldest medical mistakes in the book, prescribing a treatment that is worse than the disease.
Andy – Statistical Process Control – yes, pretty sure we did look at SPC, though not under that name, more the general case of quality control in manufacturing. If memory serves (it was decades ago) there was a recognition that other sectors had lessons that medicine might learn from, eg aviation safety and avoiding critical incidents in medicine.
SPC appears to include noise (common, inherent or random normal) variation and, in a way, signal (special causes of variation, including presumably something external triggering an ‘outbreak’ of abnormal product or in our case an epidemic ), but the same underlying problem remains, how to recognise the abnormal early on in its appearance.
The answer may well be that we should recognise that early recognition is impossible, because it requires prediction of the future based on inadequate information, or more specifically, a small signal lost in a lot of background noise. Add in chaos theory (butterfly effect, flap of a wing in Brazil causes tornado in Texas, a bat’s wing in Wuhan and a pandemic in Paris) and Schrödinger’s epidemics (the ones that only happen when you look for them) and it does all look rather like a problem that isn’t going to be solved by lunchtime.
Hats of to you, Dr. No, for your bit of hat eating. And thank you for stalwart persistence in attempting to get to the bottom of the stats. One of the things I keep asking myself is why are there so few of us who have come to rational conclusions that something is very badly wrong. Do people not at least see the chop suey mountain of chopped logic?
But then isn’t one of the standard ways to herd humans – to repeatedly give them conflicting scenarios? And hasn’t this been the official M.O. all along – from the WHO down.
From the start Whitty and the Gov. online health site told us SARSCov2 was not a serious infection for the majority, to the extent that most people wouldn’t know they have had it, or if so, only mildly. All the stats out of Italy told us early on that nearly all mortality was in the very elderly with 2 and 3 life-threatening conditions. At the same time there were official moves to stop medics round the world for turning to likely existent therapies to relieve those worst affected.
Now we have the full siege panzer vaccine roll-out, with vaccines whose trials do not end until 2022, at which time we might, if we’re lucky, see the raw data trial results. People think the vaccine will stop them getting ill, but actually it seems that it’s only designed to stop the recipient becoming severely ill but, I have read, can still infect the unvaccinated. The asymptomatic narrative thread is now employed full-on to justify the vaccination of every single person with an experimental substance whose long term effects are unknown and for a virus that most of us can deal with. (At least Merck have stood up and said this).
The drive to vaccinate all is further based on the contention that only 10% of the population has been infected, (yet is it not likely that mass of asymptomatic positive PCR results are people who have had SARS2, and are no longer infectious and therefore are not new cases). Into this confusion are thrown visions of collapsing hospitals and invading variant strains. Social outcasting of dissidents and refuseniks is being loudly drummed up. We never stop hearing the word pandemic. Every day we have the death and case statistics. It is the equivalent of a mass curse laying, i.e. a technique of psychological terrorism/social control well documented in anthropological and colonial literature. In other words, it is possible to frighten people to death.
Tish – an excellent summary of many aspects of covid past and present, thank you.
One of the intriguing possible hints about how many people have actually had covid is the results from the ONS infection survey. The latest set of results (29th Jan) reported about 1,000,000 people in England currently had covid. If we assume – very back of the envelope, this – that infection lasts 1-2 weeks, after which you are immune (and so can’t be reinfected), then each survey round will pick up mostly new cases, and so they should be added to the pool of people who have already had covid. There have been a dozen or so rounds since mid October, with between 1-2% positivity rates (Figure 1 here). Take an average of 1.5%, or around 840,000 people per round, and multiply that by the number of rounds, and we get to over 10,000,000 people, not far off 20% of the population. All very back of the envelope, but food for thought nonetheless.