
Hard Lockdown: Vital Tool or Reckless Folly?
The Big Question about covid–19, of immense historical and future importance, is whether hard lockdowns work. No one of sound mind can be in any doubt that soft, or voluntary, lockdown makes sense. Hard, or legally enforced, lockdown, with its far more stringent measures, is entirely another matter, chiefly because it comes at a very significant cost. These costs are not only highly significant, they are also wide-ranging, and include social, ethical, economic and health costs. Put bluntly, because of these costs, hard lockdown can only ever be justified if it can be shown that its benefits, measured in deaths deferred, because that is all it can ever achieve, outweigh its inevitable and catastrophic harms.
Already we are in an ethical minefield. By using the phrase deaths deferred, we remind ourselves that — and again we need to be blunt — the chief proposed benefit of hard lockdown is to avoid a number of older folk falling off their perches a few weeks early. Unlike Spanish flu, which mowed down young people, life threatening covid–19 is very much, but not exclusively, a disease of older people. Any benefit from hard lockdown will be largely for older people, while the harms will affect everyone, from the child excluded from school, to the worker unable to work, to the older patient with serious cardiac symptoms who dies at home because they delayed calling an ambulance.
Lockdowns, hard or soft, don’t directly reduce deaths. They do so instead by reducing the number of cases, and so in due course deaths, given no effective treatment is available. This might suggest that assessment of lockdown effect is as simple as plotting a curve of number of new cases by day of diagnosis, and adding a vertical line marking lockdown day. If the number of cases rises, and then peaks and starts to fall a few days after the lockdown — the few days is to allow for the incubation period — then job done, lockdown works.
There are variations: you can count deaths, which are more reliably recorded than cases, but you then have to factor in the fatality rate (still something of an unknown), and make an allowance for the interval between onset and death. Nonetheless, this is, in simple terms, the gist of Professor Meltdown’s argument. It is at the heart of his Imperial College Report 13 from March, and a later réchauffé version served up earlier this week in Nature. Cases/deaths fall following hard lockdown, ergo hard lockdown works. It is also behind his latest reincarnation yesterday as Professor Showdown, when he threw down the gauntlet to the government, by claiming its dithering over lockdown had cost 20,000 lives.
Unfortunately, none of this stands up to scrutiny. The fatal flaw — and fatal it is, so Dr No would prefer to see the good Prof reincarnate himself as Professor Pipedown — is the use of the post hoc fallacy, that because B follows A, ergo A caused B. Dr No has discussed this before, and the essence is that if B follows A, then all we can say is that A (hard lockdown) might have caused B (decline in deaths). The fact that A happens and then B happens cannot prove A caused B. To prove A caused B, we have to do an experiment, looking at what happens in two different groups, one exposed to A and the other not exposed to A.
While we cannot use B (decline) follows A (lockdown) to prove A caused B, we can however use A (lockdown) comes after B (decline) to prove that A didn’t cause B. This is because in a stable Newtonian world of cause and effect, where Time’s Arrow always goes forward, and we exclude any spooky quantum effects, we can say, with certainty, if the decline in covid–19 pre-dated the hard lock down, then the hard lockdown did not cause the decline in covid–19, because the lockdown happened after the decline.
What do we find? As it happens, there are two completely independent reports showing a decline in covid–19 pre-dating the imposition of a hard lockdown. The first, already discussed by Dr No, comes from Norway’s official Public Health Institute. Using Norwegian case and admissions data, and EpiEstim, of which an Excel version is freely available here, to estimate R, and plotting the results by date with a marker showing when lockdown happened, we get this:
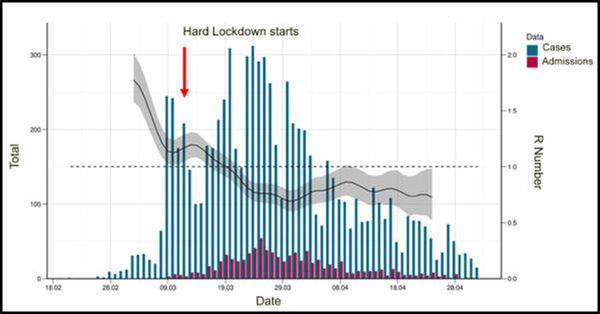
Figure 1: Norwegian covid-19 epidemic: case and admission numbers and estimated R number using EpiEstim, ploted by date, with lockdown addition and legend/label tweaks by Dr No. Original chart available here (page 9).
The second report comes from the University of Bristol. Using covid–19 deaths for England and Wales (more robust data, but also more potentially error prone workup needed), the report backtracks to infer the daily number of infections that would prove fatal, and plots them by date, with a red line marking the day hard lockdown was imposed:
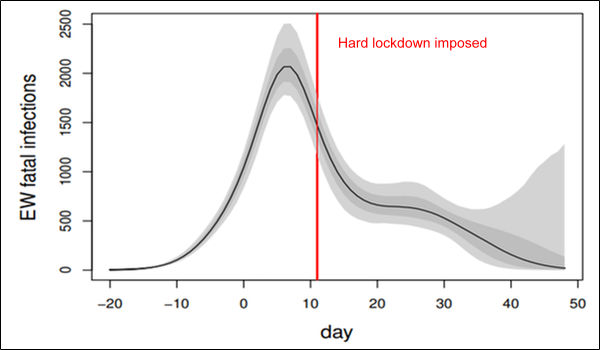
Figure 2: Inferred daily fatal infection rate for England and Wales. Light grey and dark grey regions show 95% and 68% confidence regions, respectively. The black curve is the posterior median profile. Day 0 is 13th March 2020, and the vertical red line marks the first day of UK lockdown. Minor clarity mods by Dr No. Original chart available here (page 3).
Professor Wood, the study’s author, adds that “This does not prove that the peak in fatal infections in England and Wales preceded lockdown by several days… What the results show is that, in the absence of strong assumptions, the currently most reliable data strongly suggest that the decline in infections in England and Wales began before lockdown”.
Both these plots, using different methods on data from different countries, show the decline in covid–19 pre-dating the imposition of hard lockdown. Neither are perfect, but they are accessible and consistent, and strongly suggest that, whatever caused the peak declines, it was not the hard lockdowns.
By comparison, Imperial College latest R plot for Norway (chosen because Norway also used R) is frankly bizarre:
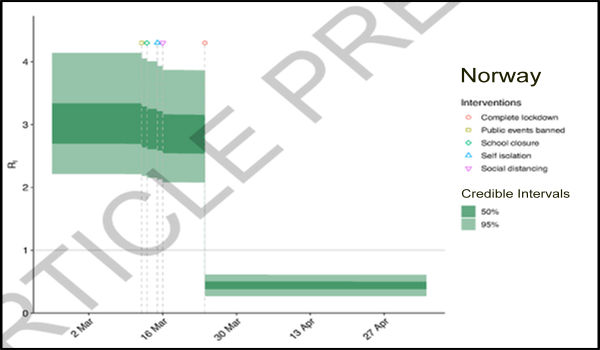
Figure 3: Imperial College Norway R number plot from Nature, with minor legend additions by Dr No. Original chart available here (page 12).
Putting aside the fact the date for hard lockdown is wrong, and is not backed up by the reference behind it, the cliff edge decline and subsequent flat-lining of R seems somewhat implausible, perhaps more in keeping with the smooth imaginings of a computer model than messy reality.
So, to answer the original Big Question? With the caveat that it is still early days, and we still have much to learn, its does seem, on the basis of the reports presented here, that hard lockdown is more reckless folly than a vital tool.
Such important information, thank you. The twisted narratives are becoming ever more shocking. This, which I read two days ago, had been posted with an apt ‘Say no more…’
https://www.gov.uk/guidance/high-consequence-infectious-diseases-hcid