
Scenarios, Dammed Scenarios and Statistics
We should be used to Patti Valley’s scenarios by now, ready to spot them, and take evasive action. Certainly yesterday’s press conference was a classic example, with the scenarios being a barrage of novel speculations on the novel strain of the novel virus. Blowjob did his stuff as a man ordered to play Falstaff while suffering from light concussion, Whitty soldiered on with his weary undertaker act, but Patti was both sublime and supreme as the man with no slides. As the robotic camera stayed fixed on the man, the man averted his gaze to the invisible slides, and intoned a commentary of impending doom. Still the robotic camera stayed fixed on the man; perhaps the robot had picked the moment to take a comfort break. Still no slides. Still the commentary, like Hrry Crpntr doing his Wmbldn commentaries, nothing to see but still the sublime commentary carries on. Dr No never did get to see the slides on the screen during the press conference. Instead, he later downloaded them from here.
The headline figures from the press conference about the new strain of the virus were that it had a higher transmissibility, perhaps 70% higher, and that it pushed up the R number quite a lot, perhaps by as much as 0.4. Even worse, there was a lot of it about, and it most likely the cause of the alarming increase in cases seen recently in London, the East and the South East of England. How much of this stacks up, and how much is just yet more scenario fuelled scaremongering?
When one looks at the slides and the headlines, many anomalies and oddities quickly emerge. The first slide nonetheless is unremarkable, showing as it does that the R number is around 1, and probably rising after a recent dip. The second slide shows the increase in cases in South Wales and South East England, spreading out like Rorschach ink blots, with cases in the hardest hit areas running at around 500-800 cases per 100,000 per week. But then, after an interlude for slide three which we will come back to, slide four shows the weekly case rate per 100,000 in the tier 4 areas to be around 350, which is about half the rate shown in slide two. The areas aren’t coterminous, but there is considerable overlap, and the dates appear to be the same, 13th December, which raises the question which — if either — scenario is correct?
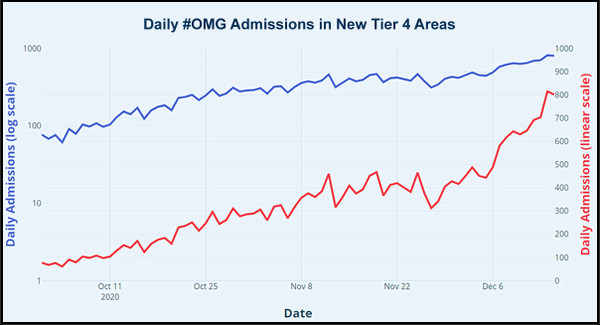
Returning to slide three, we see what looks like an alarming recent increase in hospital admissions. The recent alarming rise is partly a visual artefact caused by a dip in admissions in late November, but the chart also augments the steepness by a little light squishing of the X axis. Dr No has plotted the same data — confirmed by overlaying the two plots — as the red line, right axis in the chart at the top of this post, and already the trend looks less alarming. There is a recent rise, but that is from the late November low, and is we look at the overall trend, yes, there is a rise — but there would be, wouldn’t there — it’s winter, and we expect admissions to rise. This rise even has a long established well understood name, and it’s called winter pressures.
Slide three is a covert but classic Patti Valley this is what will happen if we do nothing scenario, only this time he didn’t extend the line for us, he let us imagine it in our mind’s eye. But what happens if we plot the line using a log scale for the Y axis, so that we can get a feel for the rate of change in the rate of increase in admissions? The blue line on the chart above does this, and what we see is far less alarming. Admissions rose in October, pretty much levelled off in November, and then rose again over December, at much the same rate as they did in October. Yes, the absolute number of admissions is certainly higher, up from about 200/day in mid October to around 600/day in mid December, but the rate of increase in admissions is much the same. If we look at the first two weeks in October, November and December, we find October had the steepest rise, 77 to 171 daily admissions (considerably more than a two fold increase), November had the lowest rise, 289 to 409 daily admissions (considerably les than a two fold increase), and December — where we are now — had the middle rise, 416 to 801 daily admissions (just under a two fold increase). The picture is one of normal winter pressures, not a pandemic out of control.
Slide five is perhaps the most intriguing one of all. This claims to show a sudden increase in the proportion of the new variant strain of the virus in test positives, rising from around 25% in mid to late November, to around 50% in mid December. The intrigue starts with the fact only percentages are reported. How many samples are these percentages based on, and were they representative of the entire population? Let’s be generous and say the numbers were sufficient, and representative, and then ask what does this increasing percentage tell us? The answer, unfortunately, is practically nothing.
We certainly cannot deduce that the new variant has a higher transmissibility, or increases the R number, and least of all that the new variant is driving the increase in test positives. Both the perhaps 70% increase in transmissibility and the possible 0.4 increase in the R number were plonked on table without even a hint of supporting evidence, and seem to be at odds with each other, for what is the R number if not a measure of transmissibility? If the current R is around 1, then a 0.4 increase is a 40% increase, not a 70% increase. It seems all these swirling numbers are yet more scenarios, yet more gathering moss from the roof and claiming to have found the real number that is the square root of minus one.
But most preposterous of all is the scenario that claims that the virus is spreading more rapidly in London, the South East and the East of England because of the new variant. The new variant may be more common than it was, and if it is a genuine increase, rather than a testing artefact — for instance, the more you look for the variant, the more you find it — then the best we have is our dear old friend correlation, and our even dearer old friend, association is not causation.
Just like all viruses, SAR-CoV-2 mutates all the time, and already there are several thousand known mutations, none of which has, so far as we can tell, increased transmissibility. Maybe the new variant, which is in fact already three months old, had a lucky break: it just happened to be present in an area primed, perhaps by a combination of seasonal factors, population density and patterns of behaviour, for a rapid growth in the number of tests positives. Merely by being in the right place at the right time, it will piggy back on the growth in test positives caused by other, and frankly more likely, factors, and will appear more frequently, without itself having to do the slightest thing. Occam’s razor strongly suggests we should not imagine heightened transmissibility scenarios in the absence of evidence, and as of today, there is no evidence of heightened transmissibility. Scenarios, damned scenarios, but not a single statistic of proof.
May be no evidence of heightened transmissibility, but certainly heightened hysteria and hyperbole – in particular, the media are pedalling all kinds of apocalyptic nonsense! The exodus of London – pics of St Pancras crowds leaving the capital!
A pragmatic way out if this…
/ Stop testing.
/ Ascertain hospital admissions and discharges – are we getting better at treating Covid?
/ Determine excess deaths in comparison to last 5-10 year average. Is it significant?
/ Then gain perspective, especially in relation to risk, and what is acceptable.
/ Regain our freedoms to choose and exercise reasonable autonomy over our lives – drop the current infantilisation of people.
/ Get the economy back on its feet to reduce imminent hardship, and pay for all of the blunders of the nanny state.
/ On-going, the government may offer advise, but it should no longer be its obsession (or ours) – there is more to effective leadership and running a country as there is too, to life (and death).
James – indeed. This hyping up of the ‘new’ variant when there is no evidence of extra harm is already causing blowback, notably in our continental ‘partners’ whose partnering response has been to lock their borders. It’s quite possible they already have the new variant but haven’t looked as hard as we have.
Shappers was on Today a short while ago with breaking news: almost all over the asymptomatic guests at a recent wedding had tested positive for covid (one tested for another reason, then the rest traced), shock horror, new variant running amok and people don’t even know they have got it! He completely missed the other interpretation: it is so trivial not one of them knew they had it.
It’s worth remembering much of the mutant panic has been generated by NERVTAG, a committee which numbers among its members a certain Professor, Professor Lockdown.
We are now moving from the sublime to the ridiculous. In less than 48 hours, we have: government press conference racks up fear of new variant virus but fails to provide any evidence => rest of the world pulls up drawbridge => Sainsbury’s announces their will be food shortages four days before Christmas => panic buying. Never before has Pelion been piled on Ossa with such fury…
‘We Are Not An Island’ campaign by HSBC, including TV ad spot overtly anti-Brexit, pro immigration – all designed to champion the UK’s internationalism.
Comical, if the circumstances weren’t so serious.
Again, the media demonstrate: power without responsibility.
It appears that other islands did so much better fending off Covid! Is this because, unlike the UK, they sensibly closed their external borders before they created new internal borders?
Political correctness trump’s pragmatism – and so it continues…
I think one factor has been overlooked by those in possession of their faculties and accustomed to reasoning from facts: the mental image (or rather fantasy) of the virus that the authorities have assiduously built up in the minds of the uncritical.
Isn’t it imagined as being like one of those unexploded – so far – but potentially devastating bombs in James Bond films?
Thus it can be depicted as extremely bad news that millions are “infected” although no one is ill.
The subliminal terror lies in the thought, “What will happen if it suddenly GOES OFF?”
You may have been walking around quite happily for months, sure of your own health and non-spreadability – and then SUDDENLY ONE DAY all the unfortunates whom you have thoughtlessly infected will fall down, writhe around in agony screaming for a while, and then die.
And it will be ALL YOUR FAULT.
I hope I have correctly interpreted the unspoken “messages” of Bozo, Witless and Unbalanced.
Perhaps we should be more decided in our rejection of vague language that is palpably intended to spread fear rather than to inform.
This “R number”, for a start. I hear it is supposed to be the average number of other people whom a carrier will infect.
What? Isn’t that utter nonsense? How can you possibly even begin to compute an average of millions of meetings, all of them different in many ways?
I suggest that we should treat the “R number” as nothing more than fear porn. It certainly isn’t science of any kind.
And as for the “New Strain” – as Dr No points out, such viruses constantly mutate and I believe I have read that there are already over 20,000 known strains of respiratory viruses.
And if it’s “more transmissible”, that’s obviously good news. Because the rule with pathogens is that the more transmissible, the less deadly. Or we wouldn’t be here to discuss the matter.
Isn’t the important factor with any virus the severity of the disease it causes, not simply its rate of transmission?
Which is worst, a fast moving virus that nearly everybody it meets doesn’t know they’ve met it, or a slow moving virus that cause severe illness and death in anyone who crosses its path?
And is it not the case that fast moving virus are not the ones that cause severe illness and death as immobilising and killing your host is an impediment to that speed of movement? So should we rejoice (rejoice) that son-of, is a faster mover than Dad?