
All That Can Be Burned Has Been Burned

Naturally enough, the UK and devolved governments, and for that matter others who should know better, have attributed the recent declines in daily covid–19 new cases and deaths to the hard lockdown measures put in place in March. This is one of the oldest logical fallacies of them all, the post hoc fallacy. This says that because B followed A, it follows that A caused B. We might just as well say the clocks changed to BST on the 29th March, and soon after that covid started to decline, ergo moving to BST got covid under control. Such divinations are more at home on the ouija board than in the realm of natural science.
#StayAlert readers will have noted that the BST possibility isn’t completely nuts, given that a number of other viral respiratory illnesses tend to decline over the summer months, and there are plausible reasons why this might be so. Another possibility is that ‘all that has can be burned, has been burned’, a positively Old Testament image given unto us by one of the Independent Sage members, meaning daily new cases decline as the number of susceptible individuals declines. But the key point here is that no proposed cause of the decline in covid can ever be shown to be the actual cause, simply on the basis that the decline followed the alleged cause of decline.
To get closer to establishing true cause and effect, we also need to know what happens when the proposed cause didn’t happen, to rule out the possibility that the effect might have happened anyway, on its own. A lot of viral illnesses, for example the common cold, are self limiting — they just get better on their own. If a doctor nonetheless prescribes antibiotics, the patient, and all to often the doctor, who should know better, wrongly attribute the recovery to the antibiotics, when this cannot be the case.
The way we find what happens without the intervention is to do an experiment. One group gets the intervention, another doesn’t, and we compare the outcomes. At its most sophisticated, this means a full blown randomised placebo controlled double blind trial, and generally such a trial is needed for a new drug. But sometimes such an experiment is simply not possible. A good example is a population level intervention, such as imposing a hard lock down. You can’t randomise countries so they receive different interventions, placebos aren’t possible, and there is no way the trial can be double blind (neither patient nor observer know who got the active treatment).
What you can do, however, is make use of a so-called natural experiment. These ‘just happen’ — nobody set them up explicitly as an experiment — which is why they are called natural experiments. The essential requirement is that two populations (or sometimes the same population in a before and after scenario) just happen to have different exposures. One is exposed to A, the other isn’t. Natural experiments have been used widely in medicine over the decades, often to look at diet and its effects on health. We might, for example, compare health outcomes between a country with a Mediterranean diet, and another with a non-Mediterranean diet.
Readers who have managed to #stayalert this far will know where this is heading: the natural experiment that compares covid deaths between two countries, one with a hard lock down, and one with a soft lockdown, to see is we can discern whether hard lockdowns have any effect. What we need to do is find two similar nations, make any necessary adjustments for any difference in population size, and compare the number of deaths. If hard lockdowns work, the nation with the hard lockdown should have fewer deaths.
There is a caveat. Natural experiments are inherently weak experiments, in that nothing is under the control of the experimenter. The experiment ‘just happens’. There are a vast number of other factors that might be at play, so we need at the very least to consider what other factors may have influenced the results, in this case the number of deaths. For covid–19 deaths, these factors include age structure of the population (more old people means more deaths), population density (higher density implies a higher R number, so more cases and so more deaths), the underlying health of the population, and finally hospital and ITU capacity.
We also need to be sure we are counting the same thing, all the more so as different countries, and even the same country, may record covid deaths in different ways. Typically, there are two ways of counting covid deaths. The first is a death of a patient with a lab confirmed covid infection, and the second is a death where covid is mentioned on the death certificate. There is still considerable uncertainty about how much under (and possibly over, where the presence of covid is coincidental) reporting there is. However, for our natural experiment, all we need to do is be sure that the counts are based on the same criteria.
Two nations well suited to this natural experiment are Scotland (hard lockdown) and Sweden (soft lockdown). Both countries make available daily numbers of hospital deaths with lab confirmed covid (see here for the Scottish, and here for the Swedish case definitions, which are in essence the same). Sweden’s population is 1.9 times larger than Scotland’s (10.2M vs 5.4M, 2018 estimates), so all we need to do is multiply Scotland’s deaths by 1.9 to compare ‘like with like’. The results are truly astonishing. The numbers of deaths are almost identical. It appears that hard lockdown has no discernable effect over soft lockdown.
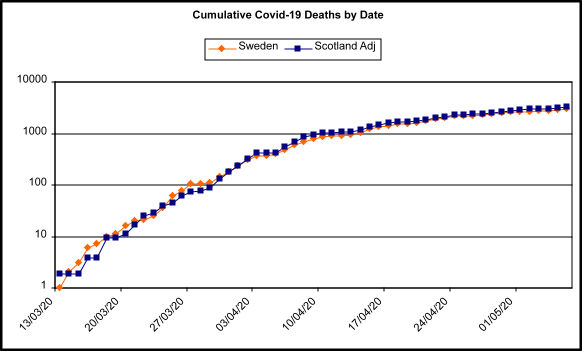
Figure 1: Cumulative covid-19 deaths by date for Sweden and Scotland, after adjustment for population size. Deaths plotted on a log scale, which transforms exponential curves into something closer to straight lines, and makes them easier to compare. Data sources: Sweden: John Hopkins University; Scotland: Scottish Government via Wikipedia. It should be noted that the official Swedish counts do not always agree, depending on where they are accessed, but they are ‘near enough’. For example, for the 14th May (last data point) JHU and worldometer.info, which uses arcgis.com, both have 3529 total deaths, while the Swedish government’s own spreadsheet has 3489 total deaths.
Now what about those other possible influences? The first is age structure. Sweden’s population is older than Scotland’s, so we would expect more deaths. We can deal with this swiftly by using age standardisation, which we can do by taking the age band specific death rates from one country, and applying them to the other country’s population in each equivalent age band. This has the effect of neutralising the difference in age structures, and gives us an expected number of deaths, which we can compare with the observed number.
The latest year for which population by age band is available for both countries is 2018. Scottish deaths by age band are only available for ‘all possibly covid deaths’ and so (not ideal, but this is the best we can do) we need to adjust those by the ratio between ‘all possibly covid deaths’ or ‘lab confirmed covid deaths’ to get the estimated ‘lab confirmed covid deaths’ by age band. With all the calculations done, we get an estimated cumulative number of deaths to the 10th of May for Sweden of 3,731. The actual, observed number of deaths was 3,225 (or 3427, depending on source, see above), meaning Sweden — with its soft lockdown — has less deaths than expected. The soft lockdown does not appear to have caused more deaths; if anything, the opposite. A spreadsheet with the data, sources and calculations is available here.
The next factor on the list is population density. Sweden is significantly less densely populated, at 25/km2 compared to Scotland, at 70/km2. Could this explain the lower numbers of deaths than expected, by way of a lower R number? Almost certainly not. Although the crude population densities are very different, it is not the crude density — which has it as if the population are spread evenly over the country — that matters, but the distribution of the density, in other words the pattern of the density. What we find is that both countries are remarkable similar. Both have a densely populated east–west belt, with the rest of the county mostly very sparsely populated. It seems most unlikely the population densities, given the similar distributions, have much affect on the number of deaths.
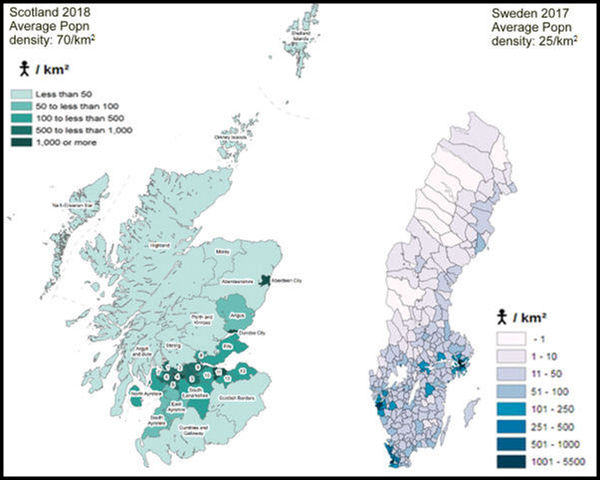
Figure 2: Population density maps for Scotland and Sweden. Scotland map from here, Sweden map from here.
Although there are some minor differences in methodology, crude urban population as a percentage of total population also suggests the countries have similar distributions, with Sweden having a higher percentage urban population at 87.9%, compared to Scotland’s 83%. Again, this suggests Sweden should have more deaths – but it hasn’t.
The last two factors to consider are underlying health, and health care capacity. There are significant differences in underlying health. The standard global measure used to assess overall health is life expectancy at birth. Sweden does well, with a life expectancy (both sexes, for someone born in 2020) of 83.3 years, while in Scotland — long seen as the ‘sick man/woman of Europe’ — it is 77.8 years. Five and a half years may not sound like a huge difference, but in life expectancy such a difference is considerable, suggesting the Scots — much as it pains Dr No to say it — really are none too healthy.
There is, so far as Dr No is aware, no way of adjusting observed numbers of deaths to take account of life expectancy when comparing two countries, given that life expectancy is such an abstract — who knows what will happen over the next 80 years — not to mention loose — in the sense that it reflects 1001 different factors — measure. Nonetheless we have to concede that it is possible that without the hard lockdown, Scotland might have had more deaths. Rather mysteriously, if that were the case, the potential number of extra deaths due to poorer health would need to match the number of lives saved by hard lockdown very closely, so they cancel out, and we get the chart we do. Dr No is inclined to view such fearful symmetry with raised eyebrows, believing as he does that it is more at home in the poetry of William Bake than in the numbered realm of epidemiology.
Neither nation has had health care capacity overloaded at any point, so we can reasonably assume that grim potential cause of avoidable deaths has never come into play, and so can be excluded as a potential factor influencing total number of deaths. On the other hand, both nations have overloaded care homes, but again the experience is similar in both countries, meaning this is unlikely to have caused differences in numbers of deaths.
Dr No continues to believe all this adds up to a very strong possibility that hard lockdowns are no more effective than soft lockdowns at reducing covid–19 specific deaths. At the same time, hard lockdowns do cause extensive collateral damage, through personal, health, social, and economic harms. It is difficult to see any justification for hard lockdowns, given little or no apparent benefit, and definite, severe and enduring harms.
It is interesting that you choose Scotland as an example of a country in hard lockdown. For one thing, unlike Sweden, Scotland is not a sovereign state in its own right, rather a semi-autonomous nation within the UK, and for another the UK as a whole is believed by many commentators to have been very slow, possibly dangerously slow, to institute full lockdown. Might a more reasonable comparison have been Finland. Like Sweden Finland is a sovereign state in Scandinavia. Its population density is 18 people per km2, which is much closer to Sweden’s population than Scotland’s, and it has a dense urban population in the Helsinki region. Finland instituted a rapid hard lockdown and has to date suffered a little over 320 deaths from Covid 19, which adjusted to Sweden’s population gives a little under 600 fatalities; rather better than Sweden with its soft lockdown. New Zealand, of course, has fared even better. Isn’t the point of statistical analysis to look at the data as a whole and to see what conclusions can be drawn, rather than to select the data which best support your thesis. As you must surely know the latter is the speciality of the pharmaceutical industry.
John Watts – Dr No welcomes your observations and agrees we must not cherry pick data to suit our pre-conceived notions. Furthermore, as he has said elsewhere, he prefers to get a good enough answer to the right question than an exact answer to the wrong question. This isn’t an excuse for sloppiness, but an exercise in pragmatism. The right question, given the undoubted harms of hard lockdown, is: do hard lockdowns save lives overall? If the answer is yes, then the more complex secondary question is: do the benefits outweigh the harms?
Natural experiments such as comparing nations/states are beset with problems, but that doesn’t mean we shouldn’t do them, so long as we are mindful of the problems.
Norway also had a hard lockdown, and has had similar deaths per million population to Finland:
But the Norwegians nonetheless have concluded, on the basis of their analysis to date, that the cause of their low death rate per million was not due to their hard lockdown, given that the Re number appeared to fall to around 1 before their hard lockdown could have had any effect.
It is also pertinent to ask why Scotland (hard lockdown, popn 5.4M) has had almost 2400 covid deaths while Finland (hard lockdown, popn 5.5M) has had around 320 covid deaths.
Interestingly, Finland has the highest percentage of the population aged 65 and over: Finland 22.26%, Sweden 20.59%, Scotland 18.87% and Norway 17.43%, which might place it at higher risk for more deaths, but clearly hasn’t.
Population pyramids can be viewed relatively easily on the CIA’s (if you trust the CIA…) website at https://www.cia.gov/library/publications/the-world-factbook/geos/fi.html, substituting the first two letters of the country’s name for the letters before .html, eg fi for Finland, sw for Sweden etc, expand the “People and Society” section and click on the population pyramid thumbnail. here’s a quick composite of the pyramids for the three Nordic countries (note the X axis scale varies depending on the country):
We don’t have a definitive answer to the do hard lockdowns work question yet, but what we do know, given the above, is that the answer almost certainly isn’t a definite yes. If that was the case, then Scotland would be closer to Norway and Finland, rather than as is the case being nearer Sweden. Furthermore, the order of magnitude of the differences in covid deaths per million (covid deaths per million to 2nd June Sweden 435.97, Scotland 436.58 but a factor of ten less for Norway 43.53 and Finland 57.75) suggest something powerful, and something more powerful than deep fried Mars Bars at that, is at work.