
All Cause Mortality, Again
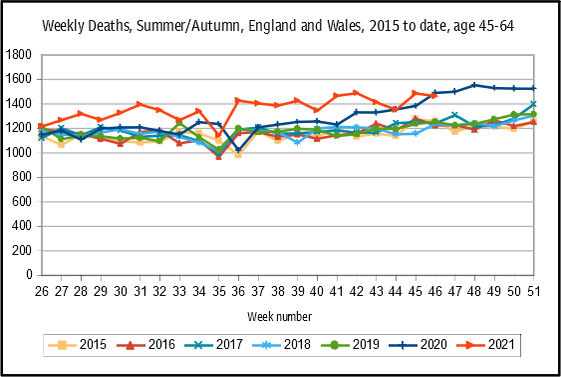
***Correction 0848 02/12/21: The 45-64 age band chart lost the 2020 line – Dr No apologises. Now corrected, and with marginally better colours. This styling will also be applied to other charts in due course. One phrase, ‘unlike the all ages and older ages charts’, removed from chart commentary*** ONS’s weekly mortality reports have rather gone off the rails for the last two weeks. A week ago, the familiar high profile double humped weekly deaths chart got disappeared, perhaps because the 2021 line was misbehaving. Earlier today, this week’s day late report opened with an estimate of homeless deaths in 2020. The reference has since disappeared, but while it was there, one naturally felt great pity for the homeless deaths, who even now must be wandering across the great plains, looking for somewhere to call home. Dr No suspects ONS might have meant deaths in homeless people. Perhaps next week it will be deaths in parachutists, which ONS will refer to as registered parachute deaths. Sooner or later it will no doubt be alcohol deaths, or rather alcohol related deaths, because in public health, one is never more than a short step away from the demon drink and its deadly toll. But Dr No’s attention is being led astray by ONS’s diversionary tactics. Once again, it is time to look at all cause mortality.
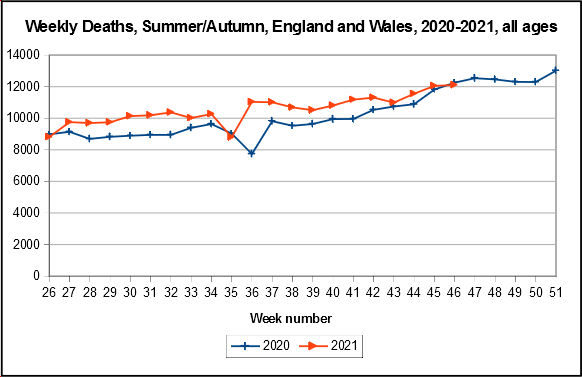
A number of Dr No’s recent posts have tried to pick fruit from the branches of various reports on deaths and other significant medical events by vaccination status. On the whole, this exercise has been as fruitful as trying to extract overcooked spaghetti from a pan using a knitting needle. Just as it seems a strand is emerging, it slithers away again. The way to get round this slippery data problem, as regular readers of this blog will know only too well, is to look at all cause mortality. Instead of poking around with a knitting needle, we upend the pan into a sieve, and that way catch all the strands, or in the case of mortality, all the deaths, in one fell swoop. The chart at the top of this post does just that, for summer and autumn 2020 and 2021, based on ONS weekly deaths data. Dr No has deliberately limited the period to summer and autumn, to exclude the distorting humps of the first and second waves, which are historical distractions to the focus of this post.
What we see is rather curious, because it is the opposite of what we might expect. Apart from delta taking over as the dominant variant in 2021, the big difference between 2020 and 2021 is covid vaccination. In the 2020 weeks (blue line), the vaccine was but a blip on the horizon; in the 2021 weeks (red line), the vaccine — which we are repeatedly told, protects against serious covid illness and death — had very much arrived. By week 27 2021, most 18 year olds and over had received their first dose (see page 14), with the same point for second dose reached in week 38 (see page 15). In broad brush terms, most adults had had their first dose, and many their second dose, during the summer and autumn of 2021. Given the vaccine — as we are repeatedly told — reduces serious covid illness and death, we should see fewer weekly deaths in 2021, compared to 2020. What we see is the opposite: for a sustained period over the summer and autumn, each week in 2021 had more, rather than fewer deaths, compared to 2020, despite widespread rollout of the covid vaccines.
Go figure, as they say. Well, Dr No did try a bit of figuring, by looking at all cause deaths by age band in recent years, downloaded from this page. This is a legitimate stratification for all cause mortality — it still includes all causes in each age band — but is somewhat hampered by ONS’s way with shifting age bands. Nonetheless, by summing the narrow bands used in 2020 and 2021 to the broader bands used in previous years, we can get comparable weekly data going back to 2015, and could even go back further, but Dr No needs to get out more often. This data is richer than the 2015 to 2019 average commonly used by ONS, in that it reveals year on year as well as week on week variation. At the expense of putting up a lot of white space, here are the charts for all ages (repeated from the top of the post, with the other earlier years added), and the various age bands, from week 26 to the end of each year, less week 52/3 to remove the distracting downtick caused by Christmas week registration delays.
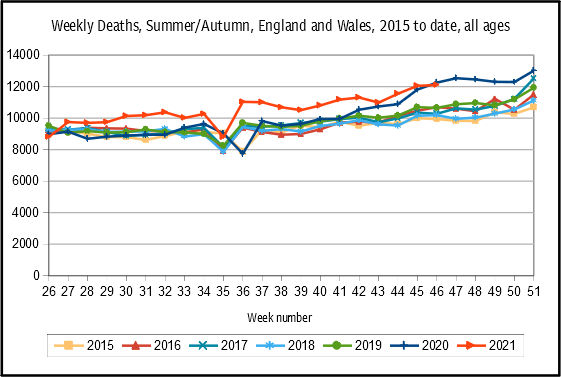
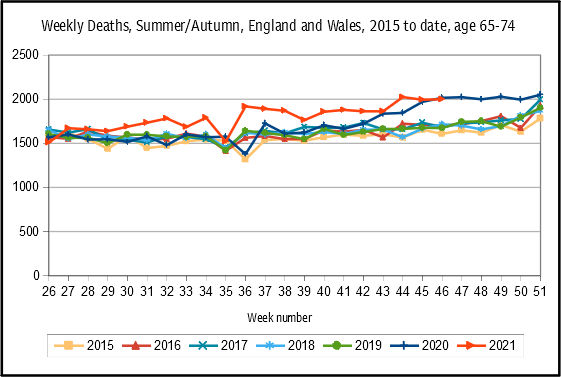
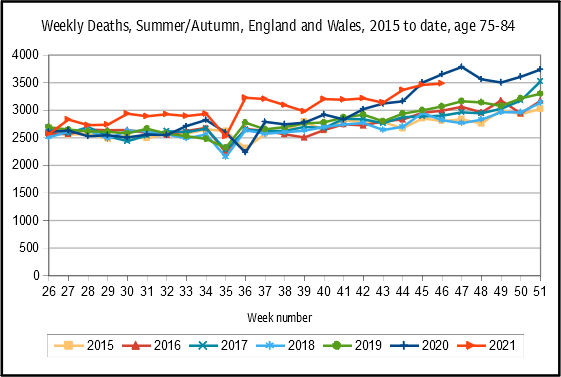
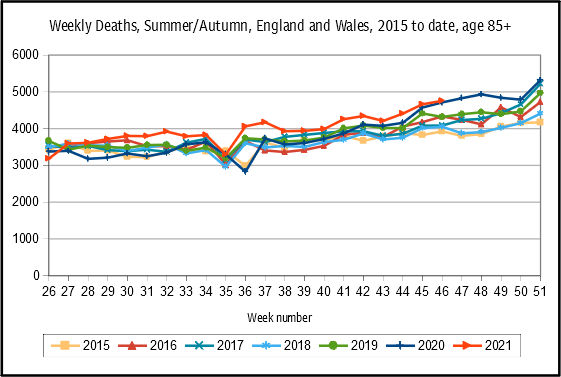
Figures 1 to 6: weekly deaths over summer and autumn from 2015 to date, all ages and by age band. Sources: ONS, see text
These charts are counts, and that’s OK, because we are comparing week on week and year on year over a relatively short time period, when the age structure of the population will not have changed greatly. Counts also have the virtue of simplicity, and avoid the need to choose age band denominators, which may themselves be significantly inaccurate. The counts are WYSIWYG – what you see is what you got.
The all ages chart confirms that 2021 was an exceptional year over the summer and autumn period: weekly death numbers between week 27 and 45 (with one Bank Holiday related exception) were consistently higher than in all previous years. Recall these are all cause deaths, so we do not need to fuss about whether they are covid deaths, though in passing we might note that the excess weekly mortality over the period is only partly explained by deaths ‘involving covid’. Towards the end of the period, the 2021 line does appear to moving back towards the 2020 line (though it is still well above earlier years): we shall have to wait and see what happens in the coming weeks. If the excess mortality disappears, we can breath a sigh of relief, but it does not alter the fact something untoward happened during mid to late 2021.
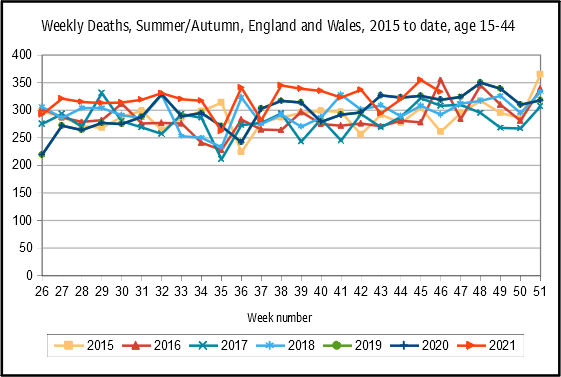
The 15-44 year olds present the sort of melee we might expect, given relatively small numbers (so more week on week variation). There is no discernable myocarditis/dead athlete effect. That does not mean such deaths have not happened, but it does suggest they haven’t happened in large enough numbers to stand out, though it is fair to say the 2021 line generally sits at the higher end of the range for most weeks. In due course, once we have cause of death data, we should be able to tease out more detail, and see whether or not individual causes of deaths showed unexpected high numbers in 2021.
The 45-64 year olds, on the other hand, show a sustained excess mortality. This is not trivial, up to about 200, or 15%, more deaths, week on week, over the summer/autumn 2021, in working age adults, many of whom, especially the younger ones, will still have children at home. Furthermore, this excess shows no recent decline. This is counter to expectations — widespread vaccination was meant to reduce mortality — and cannot easily be explained. Possible candidates include deaths due to delayed diagnosis and treatment — but why should they appear only in 2021? — or ‘something to do with the vaccines’. The 65-74 year olds and 75-84 year olds show similar, but less marked periods of excess mortality, and for the 85+ year olds the excess has all but disappeared, though like the 15-44 year olds, the 2021 line is generally at the top end of the weekly ranges.
What are we left with? We have clear evidence of excess mortality over the summer and autumn of 2021, particularly among the middle aged, despite widespread covid vaccination. The only possible tentative reasonable vaccine related conclusion is that, over summer/autumn 2021, the vaccines have not lived up to the promises made for them by their manufacturers, the government, and the mainstream media. Yet, even as Dr No writes this, the UK is throwing itself into Operation Warpshot, the hysterical rush at reduced dosing intervals to get all adults boosted and ready to fly by the end of January. Where will this all end? Daily do it yourself covid booster jabs with our breakfast cornflakes?
All cause mortality is the epidemiologist’s iron plank across the chasms of epidemiological uncertainty. It rarely, if ever, misleads. Something very untoward happened during the summer/autumn of 2021, especially among the middle aged adults. Instead of rushing headlong towards boosters for breakfast, we should take an urgent forensic look at all the data, and only then decide what to do next.
Why was the ONS data delayed this week? No explanation on ONS website I can see.
When the figures first started to rise in the summer, the ONS explanation of a backlog of registrations delayed by lockdown was just about plausible, but as this continued into the autumn that vanished.
“Why was the ONS data delayed this week? No explanation on ONS website I can see”.
I don’t know. Probably, as usual, for “raisons d’etat”.
All Cause Mortality will inevitably have started reflecting all causes by now, and it is commonly being admitted already that “other treatments”, especially cancer, have plummeted within the NHS, so what you may now be seeing is all those other causes coming to the fore. So I’m not sure Vaccination would be the causal factor in the numbers you are now looking at. I have long followed “All Cause” as my main indicator, for the same reasons as you have stated, about slippery spaghetti. “World Data”
https://ourworldindata.org/grapher/excess-mortality-p-scores-average-baseline?country=DEU~GBR
allows you to do this by country, which seems to be be a useful way of arbitrating the numbers now, as “All Cause” itself becomes inevitably more slippery.
Dr No concludes, reasonably, “Instead of rushing headlong towards boosters for breakfast, we should take an urgent forensic look at all the data, and only then decide what to do next”.
That reminds me of two quotations, each of which makes an important and highly relevant point.
First, the supreme importance of facts: beliefs that are indisputably the case, as my dictionary puts it. Facts are the foundation of all reliable investigation, and thus of science. One of my favourite authors put this short speech into the mouth of one of his characters:
“What are the facts? Again and again and again – what are the facts? Shun wishful thinking, ignore divine revelation, forget what “the stars foretell,” avoid opinion, care not what the neighbors think, never mind the unguessable “verdict of history” – what are the facts, and to how many decimal places? You pilot always into an unknown future; facts are your single clue. Get the facts!”
– Lazarus Long (in “Time Enough for Love” p. 262, by R.A. Heinlein)
If you read that carefully and reflect on the past two years, I think you will find much that is directly to the point. “[F]orget what ‘the stars foretell'” – take that, Astrologer Royal! “Shun wishful thinking”: it would be nice if “vaccines” could protect us from a vaguely defined and never-isolated disease – but apparently they cannot. “[C]are not what the neighbors think”… well, I think you see what I am driving at.
That is the recipe for true, reliable science. Unfortunately we do not live in a world where facts are respected; many people, for diverse reasons, much prefer wishful thinking, the output of astrological models, and courting the good opinion of the neighbours – not to mention avoiding fines and staying out of prison. But none of those pressing considerations can alter the facts by one iota.
What has happened in the past two years is that doctors, nurses, scientists and other experts – already trapped in the vice of bureaucratic employment that has deprived them of the right to do as they think best, or even to say what they think – have been forced to comply with the opinions of, God save the mark, politicians!
If you sought the human opinions that are farthest away from the facts, you would find them in the speeches of politicians, the regulations issued by careerist civil servants and other functionaries, and – last but not least – profit-hungry businessmen. A magnificent example, for the ages, of how to ignore the facts and brush them under the carpet in order to do what is politically expedient or profitable was given in 1973 by Senator George McGovern from the grain-producing state of Nebraska.
‘An exchange between Dr Robert Olson of St Louis University and Senator George McGovern, chair of the Dietary Committee, was recorded in July 1977.83 Olson said “I pleaded in my report and will plead again orally here for more research on the problem before we make announcements to the American public.” McGovern replied “Senators don’t have the luxury that the research scientist does of waiting until every last shred of evidence is in”’.
https://bjsm.bmj.com/content/51/10/769
“doctors, nurses, scientists and other experts … have been forced to comply with the opinions of, God save the mark, politicians!” The politicians will probably complain that they’ve felt compelled to comply with the ‘advice’ of the scientific and medical bureaucrats with whom they have surrounded themselves. Additionally the jelly-spined Boris sways to the music of the opinion polls and focus groups, with the electorate wound up into a frenzy of fear by the media.
The whole bloody Establishment needs to be culled.
First and foremost, Dr No wishes to apologise for the chart errors and shenanigans. On the error (2020 line missing on one of the charts), he can only weakly plead managing and formatting so many lines on so many charts makes herding cats a stroll in the park. On the appearance (styling) of the charts, he is still not entirely happy with the result, though the colours are now better than the previous garish Win98SE colours. The charts were done in LibreOffice Calc.
Dr No also noted the day late publication, which had been announced the previous week under ‘Next release’. Next week it appears to be back to Tuesday. Heaven only knows why… Dr No was also miffed at the disappearance of the homeless deaths in between writing the first paragraph and posting the post, hence the rather clumsily worded first paragraph.
Tom – two things broke the spirit of the medical profession. Both happened a little over a decade ago, but the first, because it had a more immediate effect, was a ramping up of GMC regulation, and then the imposition of revalidation. Dr No pointed out at the time that this was highly dangerous, because it moved the default locus of ethical control from within the doctor to in effect a quango. The individual doctor no longer decided what was right and wrong, instead, a bunch of careerists decided what a doctor should and shouldn’t do. It was a sort of Maoist cultural revolution for the profession. Meanwhile, the GMC turned into a medical Stasi, with an appalling record of guilty until proven innocent fitness to practise investigations. There are numerous posts on the old blog on these changes, including The Lies of Others, a very early Dr No post on how revalidation erodes trust.
The second was MMC – officially Modernising Medical Careers, unofficially Mangling Medical Careers. This had the effect of doing away with the old firm structure (consultant, registrars, housemen – or should that be housepersons?) and shifted the emphasis in training away from individual doctors trying to do their best to a largely tick box exercise. The effects of MMC have taken longer to work through into the system, but the effects are just as pernicious as those stemming from revalidation.
The combined effects of an over-zealous GMC, revalidation and MMC neutered the profession. Eccentric but fun doctors were instantly outlawed, and conformity became the default behaviour. The profession lost much of its heart, soul and intellectual rigour. It is very sad, but no surprise, that we are where we are today.
Dr No, thanks for your pointer to “The Lies of Others”. It seems to me to be precisely right, although I have little indirect and no direct knowledge of the NHS.
Surely the underlying trend is for those who know little or nothing useful to assert control over those who have useful knowledge and put it to good use. The American writer Albert Jay Nock (active about 100 years ago) was much concerned with such topics. He wrote, for example:
“The State claims and exercises the monopoly of crime . . . . It forbids private murder, but itself organizes murder on a colossal scale. It punishes private theft, but itself lays unscrupulous hands on anything it wants, whether the property of citizen or alien”.
– Albert Jay Nock, “On Doing The Right Thing”
“Taking the State wherever found, striking into its history at any point, one sees no way to differentiate the activities of its founders, administrators and beneficiaries from those of a professional-criminal class”.
– Albert Jay Nock
“…I thought that the formula, Man tends always to satisfy his needs and desires with the least possible exertion, should bear the name of Epstean’s law”.
– Albert Jay Nock, “Memoirs of a Superfluous Man”
The last passage – Epstean’s Law – describes what we have been discussing quite accurately. Why trouble with a lengthy and difficult education, long hours, hard work, risks and potential health problems – when you can sit in a comfortable office, hold meetings, send out diktats, and from time to time amuse oneself by persecuting honest working people? All the while earning a good deal more than the mugs who do the actual work.
A small post on the same topic.
https://bartram.substack.com/p/excess-deaths-in-england-for-those?utm_campaign=post&utm_medium=web&utm_source=copy
Thanks.
Succinct and possibly pertinent piece in The Lancet (19 Nov) about rising vaxxed infection and transmission by Gunter Kampf:
https://www.thelancet.com/journals/lanepe/article/PIIS2666-7762(21)00258-1/fulltext?s=08#%20
Concluding statement: “It appears to be grossly negligent to ignore the vaccinated population as a possible and relevant source of transmission when deciding about public health control measures.”
Doc, what do you make of what this chap has to say?
https://www.bitchute.com/video/7XXmStI8VINb/?fbclid=IwAR3T-4kW8hqK_Y7KOVrFO-7VjNRGhDeKWJ6GN0X0OLJ8vKZzZaTvJYdv_TY