
Cavernous Numbers Meaningless to Man

The PCR test is the petrol that keeps the covid pandemic running. It powers almost every aspect of the UK government’s coronavirus dashboard, and more often than not puts the tiger in ONS’s tank. A positive covid PCR result defines covid cases, covid admissions, and, more often than not, covid deaths. Without the PCR test, the pandemic would be like a car that has run out of petrol: stalled, and not going anywhere. Without the PCR test, the mainstream media too would be stalled, having precious little to report. It is, in truth, no exaggeration to say the PCR test is the pandemic, and the pandemic is the PCR test. If there was no PCR test, there would be no pandemic. How curious it is, then, that so very little attention is paid to the reliability of this mysterious fuel that powers the pandemic.
The government, the mainstream media, and the authorities across the board all consider the test’s reliability to be above suspicion. But those of us of a more sceptical mind are not so prepared to take things on trust. The use of a PCR test alone as the sole arbiter of a diagnosis is a nonsense, and the datasheets that come with the test kits say as much in so many words. The very design of the test, based on exponential multiplication, give it an absurd sensitivity. At the same time, this reliance on exponential multiplication allows the test to be used in a quasi-quantitative manner, on the assumption that the fewer the multiplication cycles needed to get a positive result, then the more original material in the sample being analysed, and so by implication, but only by implication, because no direct measure is made, the patient had a higher viral load. But as the number of cycles increases, the extent of the multiplication rapidly transits from telephone numbers, through the number of grains of sand in five miles of fertile ground, to cavernous numbers meaningless to man. After 40 cycles, a typical upper limit, a single starting fragment can, in theory, give rise to no less than 1,099,511,627,776 copies of itself (first cycle goes from 1 to 2 copies, second cycle from 2 to 4 ie 2 to the power 2, and so on up to 2 to the power 40 for the fortieth cycle).
It quickly becomes apparent that we are in the realm of the statistics of the absurd, yet, absurdly, the Ct, or cycle threshold, the upper limit on the number of cycles at which the test is considered positive, often approaches 40. In January of this year, Liverpool University Hospitals NHS Trust reported that, for one of its assays, its upper threshold for a positive result was 38, a mere 274,877,906,944 copies from a single fragment, with higher Ct values “analysed [to] determine whether the sample is a weak positive, negative or requires re-extraction and repeat PCR” — a policy which smells strongly of why let a good sample go to waste. Because assays vary, and, on top of that, there is a fair amount of black box technology in use, where software determines what the CT value cut off is and cannot be altered or amended by the user, there is no formal upper Ct for a positive test. PHE, no stranger to its own cavernous numbers meaningless to man, encourages lab technicians to keep their fingers on buzzers, when it says “live and potentially infectious virus has been isolated in laboratory cell culture from samples exhibiting high Ct (>36)” though to be fair it does add the rather tepid caveat “to what extent this indicates a potential transmission risk from person-to-person is not fully understood”.
To get an idea of a more meaningful upper Ct value for a positive test, and even then it is not that simple, as we shall see, we need to compare PCR Ct values to cell culture results from the same sample. Cell culture — inoculating cells, and determining whether the virus replicates — is the true gold standard, and a positive result means you do have, to use Dr No’s favourite analogy, a working sewing machine. It is live, or more accurately, infectious, replication-capable virus. These essential studies have been done, but not very often, and are not widely known. What can we learn from them?
The first study, published in May last year, found that infectious virus was only detected when the Ct value was less than 24, and — this is the ‘it is not that simple’ Dr No mentioned in the last paragraph, because it isn’t just about the Ct value — the symptom onset to test time was less than eight days. There are some minor caveats about the paper, but by and large it is capable of standing on its own two feet. This paper doesn’t provide a simple plot of Ct values against infectivity, but it does provide an odds ratio, which we shall use in a moment. A second paper, actually a research letter, so not a full paper, published in September last year, does however provide a plot, and as a picture is worth a thousand words, here it is.
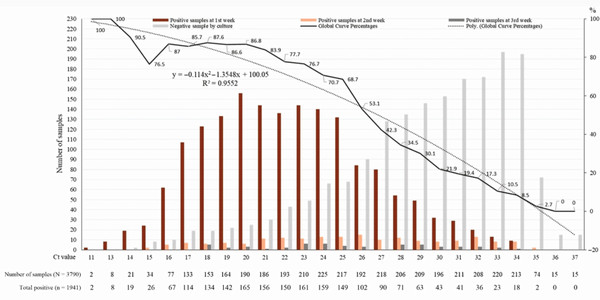
Figure 1: extracted from Jaafar et al, Correlation Between 3790 Quantitative Polymerase Chain Reaction–Positives Samples and Positive Cell Cultures, Including 1941 Severe Acute Respiratory Syndrome Coronavirus 2 Isolates, Clinical Infectious Diseases, Volume 72, Issue 11, 1 June 2021, Page e921, full size image here
The key line of interest in this rather busy chart is the dotted grey curve running from top left to bottom right, indicating the percentage of patients who were positive on culture (values on right Y axis) for each Ct value on the X axis. It is the smoothed line derived from the solid jagged line which shows the actual percentages for the Ct values along its path. We can see that, as the authors say, “at Ct = 25, up to 70% of patients remain positive in culture and that at Ct = 30 this value drops to 20%. At Ct = 35, <3% of cultures are positive”. At a Ct of 35, three Ct points below Liverpool’s cut off of 38, only 3% of cultures were positive. Put more broadly, this means that most high Ct positives are false positives. A very similar finding appears if we apply the odds ratio reported in the first paper (0.64) starting at a Ct of 24, and generously assuming that corresponds to 100% true positives, to subsequent Ct values. The percentage of true positives rapidly declines, and reaches just under 3% at a Ct of 32.
The only missing piece of the jigsaw is the distribution of Ct values: what are the actual Ct values if you run a large number of routine tests? If most of them come back under say 24, then perhaps most of them are true positives. But what if most of them are over a Ct of 24, with many in the low 30s? Then most of the results are likely to be false positives. The NHS does not appear to publish these distributions — Dr No can’t possibly imagine why not — but there are some papers that have data, including the research letter above. The first row of figures immediately under the chart’s X axis gives the number of PCR positive sample for each Ct value immediately above it, and we can see the values are widely distributed across the range of Ct values, with perhaps half the Ct values under 25, and the other half over 25, with many in the low 30s. A very similar distribution appears in this paper, seen in this chart. Both of these distributions appear to be from routine collections of samples, and although neither is from the UK (one is American, the other French), and one included only symptomatic patients (the other doesn’t say), there is no reason to suppose UK results are likely to be hugely different. A quick and dirty composite montage of the two sets of data looks like this, and confirms the similarities.
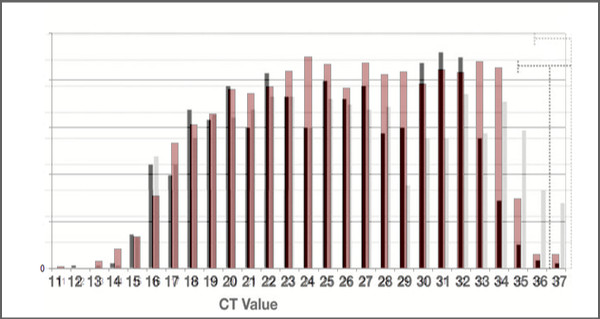
Figure 2: montage of the Ct value distributions from the American (monotone) and French (coloured) data sets, confirming broad similarity of the distributions
We have been taken on a monumental ride, fuelled by the dangerously volatile petrol of the PCR test. An extreme interpretation of the data presented in this post is that the covid PCR test is meaningless — and that is without factoring in the importance of the timing of the test. Recall the first paper suggested that any positive test done eight or more days after symptom onset is most likely a false positive, yet in the UK the standard interval for a ‘covid connection’ is 28 days. A more generous interpretation might be that half of all positive test results are false positives because the Ct value was too high, and of those, half again were false positives, because the test was too remote in time from the event, meaning only a quarter of the reported positive tests are true positives. Or whatever. The pandemic collapses, lost forever in those cavernous numbers meaningless to man.
“How curious it is, then, that so very little attention is paid to the reliability of this mysterious fuel that powers the pandemic”.
Yes… and no.
“Pay no attention to that PCR test behind the curtain!”
Catte Black wrote a very good and compact piece explaining this.
‘Repeat after me: “The PCR tests don’t work!” The pandemic is only as real as the test, and [the] test is a dice roll’.
https://off-guardian.org/2021/08/03/repeat-after-me-the-pcr-tests-dont-work/
She refers to Torsten Engelbrecht and Konstantin Demeter’s equally good
“COVID19 PCR Tests are Scientifically Meaningless”
https://off-guardian.org/2020/06/27/covid19-pcr-tests-are-scientifically-meaningless/
And she even points us to whom I consider the ultimate authority: Dr Kary Mullis, who won the Nobel Prize for inventing the PCR test. I think we can assume that he understood how it works pretty well, including what it can and can’t do.
‘PCR Inventor: “It doesn’t tell you that you are sick”’
https://off-guardian.org/2020/10/05/pcr-inventor-it-doesnt-tell-you-that-you-are-sick/
I read that the SARS-CoV-2 virus (alleged) measures about 100 nanometres in diameter (one-tenth of a micron). This is about 1/200th of the width of a human hair.
Use PCR to turn that single virus into a trillion (roughly); the result will be something about the size of a cube or sphere 1 mm across. By viral standards, that is gigantic. After all, you have just done the equivalent of turning one human being into a trillion – about 1,200 times the total population of Earth today.
But what was that original individual? Was it a regular standard human, or just conceivably a chimp, an orang-utan, or a baboon? We humans share over 95% of our genes with chimps, so there’s really a very slight difference. (Yes, all right, inside Whitehall and Downing Street there is no detectable difference at all).
Or maybe you could start with a chimp and wind up with a trillion humans…
Aaaargh! My old nemesis – arithmetic. Of course
“…about 1,200 times the total population of Earth today”
should read
“…about 120 times the total population of Earth today”.
Before shutting up (only temporarily) may I point out Dr Kendrick’s last article:
“I have not been silenced”
https://drmalcolmkendrick.org/2021/09/03/i-have-not-been-silenced/
In which Dr Kendrick wrote:
“My self-appointed role within the COVID19 mayhem, was to search for the truth – as far as it could be found – and to attempt to provide useful information for those who wish to read my blog.
“The main reason for prolonged silence, and introspection, is that I am not sure I can find the truth. I do not know if it can be found anymore. Today I am unsure what represents a fact, and what has simply been made up. A sad and scary state of affairs.
“This is not just true of the mainstream and the mainstream media, which has simply decided to parrot all Government and WHO statements without any critical engagement…or thought. For example, the BBC intones that ‘In the last day, fifty people died within twenty-eight days of a positive COVID19 test…’ Or a hundred, or six. What the hell is this supposed to mean? It means nothing, it is the very definition of scientific meaninglessness.
“Especially when it seems that very nearly a half of those admitted to hospital with COVID19 were not admitted to hospital with COVID19. They were admitted with something else entirely, then had a positive test whilst in hospital. In short, they were not admitted to hospital with COVID19, and almost certainly did not die of COVID19. They died with a positive COVID19 test. With, not of”.
In the beginning, a ‘case’ was a clinical case, as defined by clinical criteria. Then, once community transmission had become established, only those cases deemed unwell enough to merit inpatient review or hospitalisation were tested by PCR (plus some early-ish testing of symptomatic care home staff and residents in some areas). Community cases were given presumptive diagnoses based on clinical presentation.
After Spring 2020, a ‘case’ became a positive PCR test, regardless of symptoms, and society developed an obsession with tales of the asymptomatic super-spreader. From that point on we were lost.
Some cases remain cases (if a case is to be defined as a positive PCR) for months after their original infection.
Those in charge have always had it within their gift to fine-tune the testing policy. To do so would reduce the noise, allow us to concentrate our limited resources where it would make the greatest impact, and lessen the deleterious impact on the health service of indiscriminate testing. That they have not yet chosen to do so, speaks volumes.
Tom – lots of people have said the PCR test is meaningless as a diagnostic test (including Mullis in his generic remarks), but the arguments put forward are usually largely theoretical (no isolate, no gold standard, Koch gone to pot (though for viruses, Koch is somewhat strained) etc). The point of this post is to look at actual use in the real world, where gold standards have been used, and what the likely distributions of Ct values are, and what that means in practice. Although only barely touched on, there is also a big problem with timing, with anything up to 28 days being far too long an interval.
Let’s be charitable, and say, done properly, the covid PCR test can detect SARS-CoV-2 RNA, and then consider what is happening in the real world. What this post shows, based on two independent studies, is that as Ct values increase, the chances of a false positive (positive PCR but negative culture) increase (Figure 1; the other paper says much the same thing, but expresses the result as an odds ratio). If we then combine that information with the likely distribution of Ct values from routine testing (Figure 2), then we can say that in all likelihood that the majority of PCR positves are false positives. That, at a stoke, halves the size of the pandemic: half the number of true positives, half the number of admissions, half the number of deaths. Dr No is not trying to – and cannot – put an exact figure on the number of false positives, based on the data in the post, but what he believes he can do is show that there is a major problem of over-diagnosis of covid that has been largely swept under the carpet by the authorities.
Helen – “That they have not yet chosen to do so, speaks volumes.” Indeed. Short of becoming an outright conspiracy theorist, the only ‘rational’ reason for not fine tuning the diagnosis, or better still returning to the traditional concept of a case being first and foremost a person with symptoms, is an obsession bordering on the psychotic for power and control. Dr No is sure he has mentioned it before, but public health carries within it a very strong streak of passive aggression. Give the little people who feel they have been down-trodden and ignored for too long some power, and all hell breaks loose.
Could it be that vaccinated people are more prone to yield false positives?
dearieme – short answer, unknown. All the papers used in this post were first published last year, so pre-vaccination.
Dr No, I fear that you seem to be looking at the issue upside down. You say that the objections to the validity of the PCR test for Covid-19 are “largely theoretical”; but as far as I know there exists no proof that the test accomplishes what it is believed to. Surely, before putting such enormous weight on a test (or rather a test-protocol combination) we should be quite sure that it does what it says on the tin. No one has ever done that.
Going back to the start, has anyone ever isolated SARS-CoV-2 in a pure form? As far as I know, they have not. In their paper “COVID19 PCR Tests are Scientifically Meaningless” Torsten Engelbrecht and Konstantin Demeter said the following:
https://off-guardian.org/2020/06/27/covid19-pcr-tests-are-scientifically-meaningless/
‘…PCR is extremely sensitive, which means it can detect even the smallest pieces of DNA or RNA — but it cannot determine where these particles came from. That has to be determined beforehand.
‘And because the PCR tests are calibrated for gene sequences (in this case RNA sequences because SARS-CoV-2 is believed to be a RNA virus), we have to know that these gene snippets are part of the looked-for virus. And to know that, correct isolation and purification of the presumed virus has to be executed.
‘Hence, we have asked the science teams of the relevant papers which are referred to in the context of SARS-CoV-2 for proof whether the electron-microscopic shots depicted in their in vitro experiments show purified viruses.
‘But not a single team could answer that question with “yes” — and NB., nobody said purification was not a necessary step. We only got answers like “No, we did not obtain an electron micrograph showing the degree of purification” (see below)’.
So there is no “gold standard” with which to check whether PCR tests are accurate – that they turn out positive if, and only if, the patient is actually infected with SARS-CoV-2. (The disease apparently has no unique symptoms).
The protocol for applying the PCR test is also deeply suspect. To begin with, the Corman-Drosten paper https://www.eurosurveillance.org/content/10.2807/1560-7917.ES.2020.25.3.2000045 that specified the protocol was written and submitted literally within a week after the first reports coming from China. No viral material was available, so the authors filled in the gaping holes by computer modelling. It seems peer review was carried out in two days, and publication followed a day or two later!
https://cormandrostenreview.com/report/
Tom – saying the objections are ‘largely theoretical’ is not necessarily to dismiss them, but to say that the arguments used are more theoretical than practical/experimental. The argument in this post is practical: (assuming the test is capable of being valid) what is the relationship between Ct value and infectivity in cell culture? What are the distributions of Ct values in routine testing? Answers as in the post. So even if the test doesn’t fail on theoretical concerns, it still has some pretty major practical problems. This practical argument – the test fails in practice – is complementary to any ‘largely theoretical’ objections, not instead of them.
“The argument in this post is practical: (assuming the test is capable of being valid)…”
And that is my problem. I suspect that the reasons for assuming that the test is valid are far more political and emotional than scientific. Indeed, I suspect that there are no valid reasons for trusting the test, the protocol, or the combination.
Tom – if people do believe the tests are valid for political and emotional rather than scientific reasons, then it is likely to be very hard to have a reasoned debate with them. They have their belief, and will find ‘evidence’ to suit. Far simpler to say, OK, you believe the test is valid, but how does it work in practice? Answer, not very well at all.
True, O King – live for ever!
I must admit you are right.
Incidentally, Dr Coleridge, congratulations on your literary flourishes. I think your blog is the one that gives me the most aesthetic pleasure to read.
Tom – you are both gracious and kind. Thank you.
Worth adding that the ‘largely theoretical’ objections are actually quite complex, and require a good understanding of virology to verify. Even Dr No struggles at times. For example, the no one managed to say they had purified virus ergo you can’t be sure you have the right sequence is both theoretical (it uses logic to make its point) and also requires an understanding of what the genome is, and and why it matters – and then it has to be squared with things like CDC saying they do have virus isolates (ie pure virus), and have made it readily available for use by the scientific community. Joe Public is likely to struggle with these arguments, and many will say if the scientists say they’ve done it, that’s good enough for me. The point of this post is to take a different approach and say: let’s put aside those complicated questions – let’s just assume that it might work – and consider how well does it perform in practice? Answer (based on some relatively straightforward research): not very well at all.
One doesn’t need to be a conspiracy theorist to see how and why the world’s gone a bit potty. It started to go really potty around the 1970s. It was up to that point only slightly potty!
Once one understands the underlying structures which are driving behaviour, it becomes easy to make sense of it.
The drivers necessary go pretty deep and start with the neoliberal ideal, the move away from a gold standard and towards a full fiat currency, the appointment of advisers who were or are part of the neoliberal pharmaceutical complex.
Regulatory capture by vested interests, MHRA is now funded by private interests (at least the part which deals with drugs and vaccines etc).
The fiat government controlled money system, which claims to be short of money and must tax. It doesn’t need to tax (at least not for the reasons given by Government and the media), and indeed the magic of fiat money and QE has shown by the click of a few keys on a computer that money can be magicked into being.
There’s a lot more to these interconnected systems, and this short reply will never do it justice.
Ultimately, they are a mixture of ideologies and control mechanisms, which in the end drive all behaviour.
Doc,
Could you take a look at the Bangladeshi villages mask RCT that is predictably being trumpeted as proof masks work?
It seems to me that all the RCT part does is show the effect of certain strategies to get people to wear masks and that those may have influenced transmission, rather than it being incontrovertibly any direct effect of masks themselves- i.e there are confounders that may be responsible for the observed results (which kind of defeats the object of an RCT)
FWIW the economists behind the study were clearly vehemently pro-mask to begin with – one of them has used a masked profile pic on twitter.etc
@James: on masks my policy is simple – look only at studies performed before the pandemic. They show, virtually universally, that surgical masks impede neither inward bound nor outward bound infection.
If pandemic studies imply otherwise they must be dishonest or incompetent because the fluid dynamics of aerosol dispersion does not depend on which virus is involved.
James – the paper runs to 94 pages, and as you know, the lead author is an economist (the discipline that makes astrology appear rigorous) leading on a medical paper – not a promising start. The language borders on the bizarre in places, there is a lot of small print, the analysis is painfully over-complicated, and the results are not presented in a conventional format…
Nonetheless, the premise and conduct seems fair enough, though confounding is impossible to rule out eg a Hawthorne effect in the intervention group (taking an interest in a group of people makes them change their behaviour). But the real problem is the results are presented as relative risks, always a warning flag, and they are not that great. Although the underlying numbers are not presented, the RRRs are at best borderline significant or, in the case of cloth masks, not significant (confidence intervals are in [] brackets after point estimates; and Dr No has no idea what an imprecise zero is, it has always seemed rather a precise concept to his way of thinking):
“[W]e estimate a roughly 10% decline in symptomatic seroprevalence in the treatment group (adjusted prevalence ratio (aPR) = 0.91 [0.82, 1.00]) for a 29 percentage point increase in mask wearing over 8 weeks. In the second panel of Figure 1, we split our results by mask type (surgical vs. cloth). We find clear evidence that surgical masks lead to a relative reduction in symptomatic seroprevalence of 11.2% (aPR = 0.89 [0.78,1.00]; control prevalence = 0.80%; treatment prevalence = 0.71%). For cloth masks, we find an imprecise zero, although the confidence interval includes the point estimate for surgical masks (aPR = 0.95 [0.79,1.11]; control prevalence 0.67%; treatment prevalence 0.62%).”
The thing that jumps out from Figure 1 is the symptomatic seroprevalence percentages are small – all less than 1%. We can do a bit of reverse engineering, and get estimates for the unreported absolute numbers. This matters because large relative risk reduction can hide tiny absolute risk reductions. For the control group, 0.76% of 146,783 is 1,116, and for the intervention group, 0.68% of 160,323 is 1106, an absolute difference of only 10 cases. If we run this through an AR/RR calculator, we can confirm that the RRR is 9.3%, but the ARR is a rather less impressive 0.000704, 0.07%, or, scaled to the study numbers, 7 per 100,000. The NNT is 1419.
Incidentally, the 5% RRR shown for masks is incorrect: 0.76% to 0.74% is a RRR of around 2.6%, not 5% as shown in Figure 1.
Borderline or no statistical significance despite large numbers (the large numbers in the study will have helped improve the chances of significance here), and a frankly paltry ARR and huge NNT – this is not a world-breaking discovery. This study suggests wearing masks makes a minimal difference of borderline significance; for cloth masks (most common mask seen by Dr No here in the UK), the effect is trivial and non-significant.
Nowadays, sadly, one can usually understand the motives for any study – no matter how badly done and presented – simply by following the money. (Sometimes money travels in indirect ways, as when someone is awarded a chair or a lucrative publishing contract).
Otherwise, how did “The Lancet” ever publish this?
‘Updated: Lancet Published a Fraudulent Study: Editor Calls it “Department of Error”’
https://ahrp.org/the-lancet-published-a-fraudulent-study-editor-calls-it-department-of-error/
May I bring to everyone’s attention the latest superb (though long) article by Simon Elmer:
“The UK ‘Vaccination’ Programme. Part 1: Adverse Drug Reactions and Deaths”
https://architectsforsocialhousing.co.uk/2021/09/15/the-uk-vaccination-programme-part-1-adverse-drug-reactions-and-deaths/
Don’t be put off by the site’s title “Architects for Social Housing”; that is Mr Elmer’s main focus. Although he posts rarely on Covid-19, his articles are absolutely marvellous – deeply researched, absolutely logical, and very instructive indeed.