Why Mathematical Modelling Is Dangerous

A lot hinges on mathematical modelling these days — lockdowns and climate change being two extreme examples — yet Dr No suspects, based on a recent chat with an arts degree educated contemporary friend of his, that those without a scientific background are not always entirely sure what modelling is (Dr No uses modelling in this post to mean mathematical modelling, not modelling Airfix battleships or balsawood planes), and so end up either being led by the science, like a bull led by the ring in his nose, however preposterous the so-called science, or alternatively end up decrying the whole bally lot as humbug, and no better than lies, damned lies and statistics. This post is an attempt to make modelling clearer — what it is, and is not — to those without a science background, and to provide a sound reason why we should all treat predictive modelling with extreme caution.
Modelling today means two related but very different things. The first meaning is to fit a model, or, in old parlance, an equation, or formula, to some observations, or data, we have on some variables (things that vary…). Let us say we have measured different heats of a bulb, and the light it emits at those different heats. Dr No could have measured the heat of some arguments, and how much light each generated, but the results are likely to be complicated because heated arguments tend to produce less light, so lets stick with light bulbs, and rather than do the experiment in the lab, we can, for our purposes, do it in a spreadsheet.
Using the spreadsheet, Dr No created a table with two columns, one for heat and one for light, and entered values — the units don’t matter here, it’s the relationship between the two that matters — such that the amount of heat was always exactly twice the amount of heat. This is the ‘perfect’ scenario, the absolute, let’s say Newtonian, or natural, law: light = heat x 2. However, whenever we take measurements, we almost invariably get slight random variations, so Dr No has added a small degree of random variation to the numbers, and plotted the result (Figure 1).
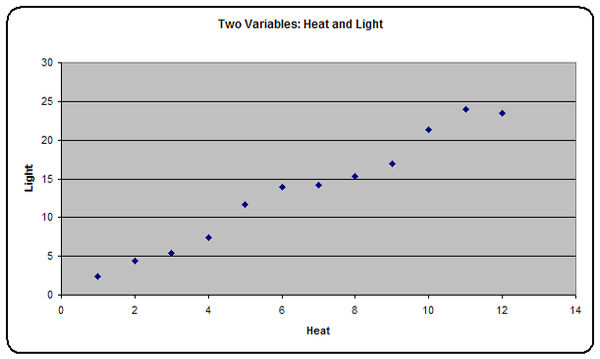
Figure 1: Heat and light plotted for each bulb measurement.
Already we can clearly see a pattern, or relationship, appears to exist. As heat goes up, so does light. We could easily get a ruler, and visually add a best fit line, but nowadays the computer can do this with ease, and at the same time calculate the formula, or equation, that describes the line. This formula is what is now called ‘the model’, and it is the mathematical relationship between the two variables. The plot with the line and formula added are shown in Figure 2.
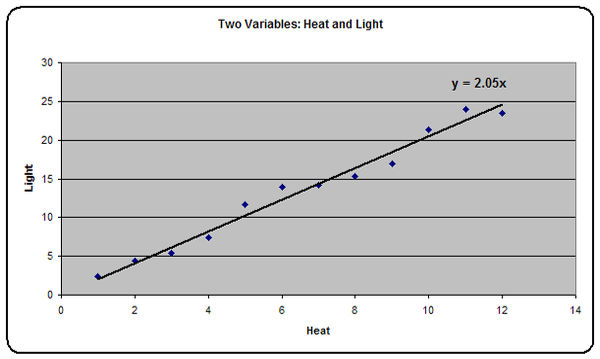
Figure 2: Figure 1 with line and formula (equation) added.
We can see that because of the random variation, the equation, or model, isn’t the perfect light = heat x 2, but it is close (light (y) = heat (x) x 2.05). By and large, the more measurements we do, the closer our model will get to reality. If on the other hand we only have a few data points, say heat points 6, 7 and 8, we would have a markedly different line, and so model; and if we had the last two points, heat points 11 and 12, we would have a hopeless model that suggested light bulbs were like arguments: the more heat, the less light. This is the main reason why we tend to be very wary of small sample sizes: the data may even just by random chance — that was all Dr No added — be freakish, and so our model is hopelessly misleading.
Nonetheless, if we have done things carefully, and collected enough data, we will have a model that describes the relationship between our two variables. We could use more variables, or we might find the line is curved, as in the exponential time plotted against number of cases curve of an epidemic, or that the line has an offset (doesn’t go through zero), we might use the fastest most capable computer on the planet to fit the line and do the sums, the resulting formula might be appallingly complicated, but at heart the modelling process is the same: to find a model (formula, equation) that describes the relationship between the variables.
Once we have a model, we can make predictions, and this is where things start to get interesting, in the Chinese way. The simplest prediction is to predict values that lie in between our observation points. We can predict, from our equation, or model, that a heat value of 6.5 will produce a light value of 6.5 x 2.05, or 13.325. This process, of predicting intermediate values between the values we do have, is called interpolation. It is generally reliable, providing the practical science was done well enough, and is generally rather boring.
But we can also make predictions that extend beyond our data. We can use the formula, or model, for higher heat values, and get a prediction of the light output. There is nothing, on the face of it, to stop us from saying that if we have a heat value of 24, we will get a light output of 24 x 2.05, or 49.2. This process of extending our prediction beyond our data is called extrapolation, and it is where the science ends, and the numerology begins.
This scenario is the second modern meaning of modelling, and the meaning it has when we read and hear of ‘models’ and modelling in academic journals and the media. Ferguson’s modelling that triggered the lockdown was modelling in this its second meaning: to predict beyond the limits of what is known.
The fundamental problem here is that we are dealing with unknown unknowns. Our light bulb model can provide a very simple example. The unknown unknown for the modeller who predicted a light output of 49.2 given a heat value of 24 is that these bulbs blow at a heat output of 20. Pwoof! The bulb becomes an ex bulb, and there is no light output, just a darkened room with a twisted frayed filament in a glass bulb, and a predictive modeller with a red face. The prediction of a light output of 49.2 given a heat value of 24 is complete nonesense. We might as well use a one armed bandit with knobs on to predict the future.
This is why all of Ferguson’s predictions, past and present, have been wrong. No one, not even Ferguson, can predict unknown unknowns, which in a pandemic are likely to be many and varied. It is why we should all distinguish between science — the first meaning of modelling, fitting an equation, or model, to known data — and the second meaning — forecasting, predicting, crystal ball gazing, numerology, call it what you will. Unknown unknowns are what make predictive modelling at best dodgy, at worst little better than a one armed bandit in a white coat. And like all bandits, bandits in white coats — perhaps because they are in white coats — can be very dangerous.
Dr No is not quite ready to say predictive modelling should be avoided like the plague, if that is the right phrase, in pandemic policy making, but there are times when he gets very close to thinking it should. At the very least, all predictive modelling — what Dr No routinely calls numerology — should always carry a large warning: Contains Numerology Dressed as Science — Only Use with Extreme Caution.
By George, I’ve (finally) got it!
Cheers for this DN.
And now I’ve got it, yes indeed, predictive modelling should always carry a very large warning and only used with extreme caution.