
Twitter Itch
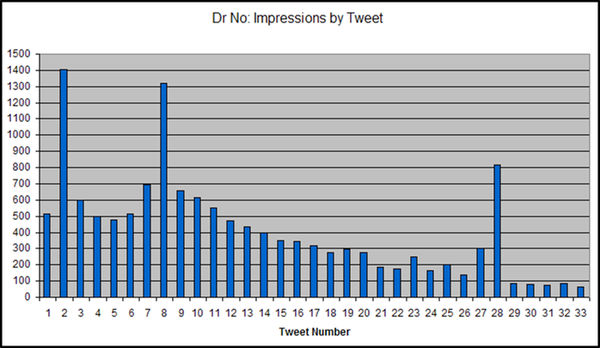
Is Dr No the Pope? Probably not. Is Dr No’s twitter account being censored? Very possibly. Impressions — twitter jargon for the number of times a tweet has been served up by twitter — by tweet (see chart) since Dr No re-started posting and tweeting in late March 2020 have over the for the last five tweets flat-lined below 100, between 63 and 86, with a mean of 77.6 impressions (median 81). The preceding 28 tweets all gained over 100 impressions (two tweets gained over 1,000 impressions), with an overall mean of 481.2 impressions (median 424.5). With only 33 tweets in all, the numbers are small, but nonetheless, there is a substantial difference between the average number of impressions gained by tweets 1 to 28 (481), and tweets 29 to 33 (78). Goldfinger’s Rule — happenstance (tweet 29), coincidence (tweet 30), enemy action (tweet 31, and for that matter tweets 32 and 33) — is more than met. Something is going on.
Has Dr No started writing cr@p? Of course not – but Dr No would say that, wouldn’t he? What about the evidence? We’ll come to impression numbers in a moment, but first let us consider engagements — twitter jargon for the number of times a tweet has generated some sort of action, such as a like, a retweet or a link click, — and, more usefully, engagement rates. Engagement rates are widely used and regularly abused, not least because there are multiple ways in which the rate can be calculated, and it is impossible to know whether rates can be compared unless the formula used is made plain.
Twitter’s own analytics, for example, calculates the engagement rate for individual tweets as engagements divided by impressions for the post, expressed as a percentage, and uses a similar formula (daily engagements divided by daily impressions, expressed as a percentage) for daily engagement rates. Period engagement rates (last 28 days, calendar month of May etc) appear to be close to (the exact formula is not available) an average of the daily rates for the period, rather than all engagements divided by all impressions for the period.
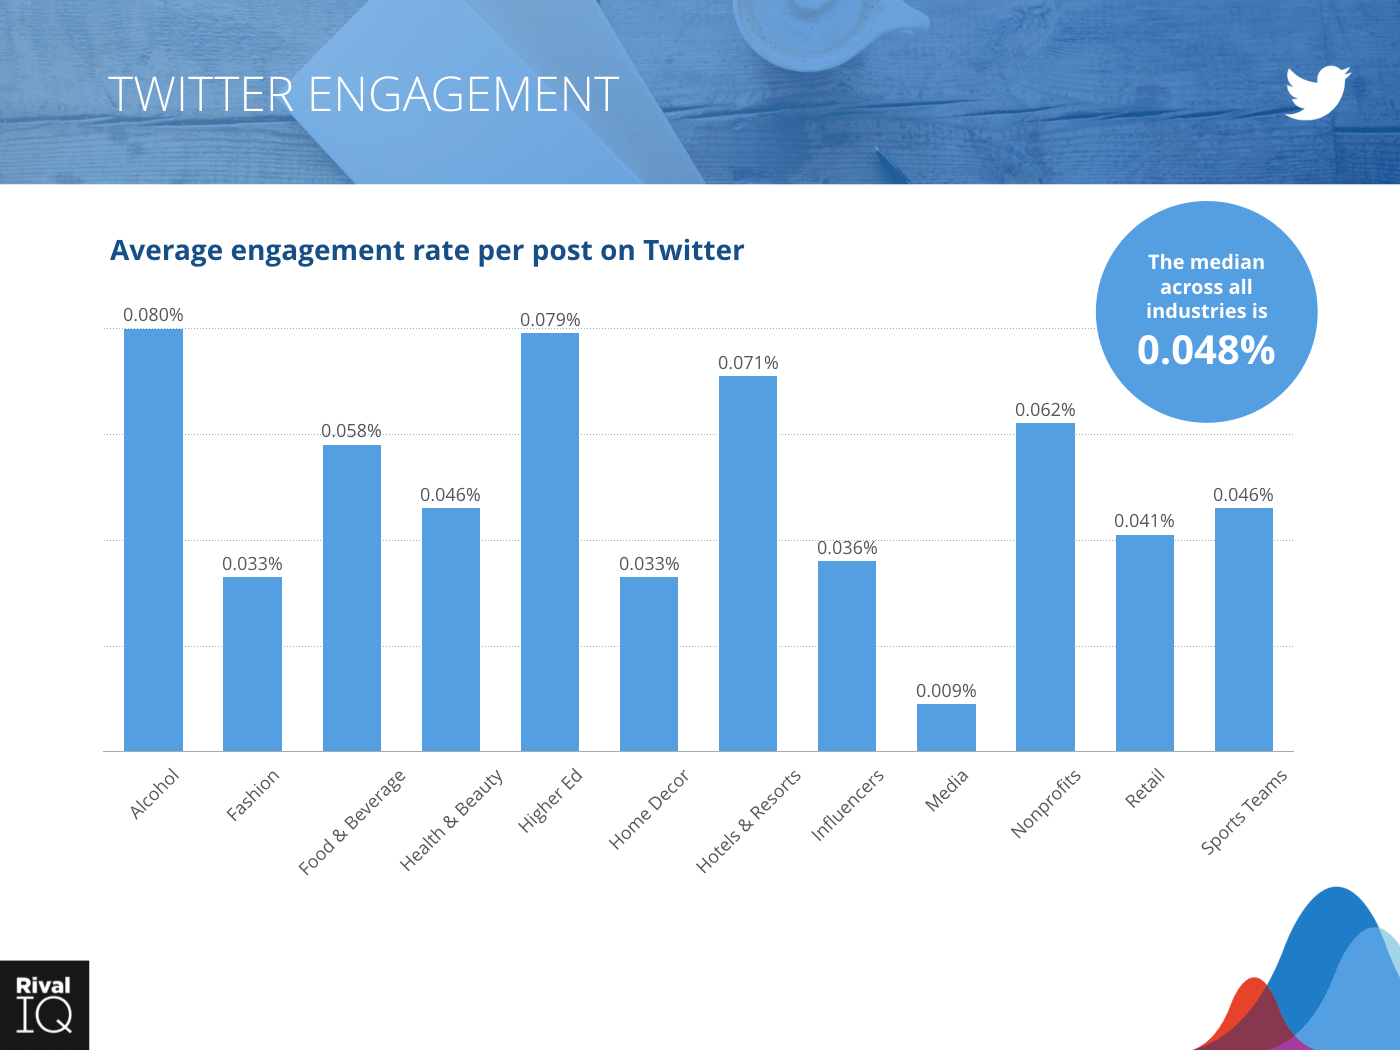
Rival IQ, a high profile social media benchmarking outfit, on the other hand, calculates rates based on engagements divided by number of followers, an entirely different measure, not so much apples and oranges as oranges and golf balls. Since Rival IQ benchmark engagements rates are typically very low, and twitter engagement rates are typically at least an order of magnitude (or more) higher, many a hopeful twitter addict has diddled themselves into believing they are far better than average by using the Rival IQ benchmark compared to their twitter analytic rate.
Such is the way of twitter and its analysts. Dr No actually prefers twitter’s system, as it seems more useful to assess how many engagements a tweet gets, given its impressions, than a rate based on numbers of followers, all the more so as some of the engagements will be by non-followers. Be that as it may, benchmarks for twitter formula based rates are not, so far as Dr No can see, widely available. So he has calculated his Rival IQ formula engagement rates, and the results suggest Dr No is not tweeting cr@p. Rival IQ’s widely quoted all industry (they actually mean sector) median engagement rate is of the order of 0.048%. Dr No’s average tweet engagement rate for May 2020, calculated using Rival IQ’s method, is 4.7%. Granted, Dr No’s tweets are intended to prompt engagement, as most are a post announcement, with a clickable link to the post, but even so, Dr No’s rate is two orders of magnitude higher than the median. Unless that, is, Rival IQ have ‘accidentally’ added % (per hundred followers) when they meant per individual follower…
If Dr No has a high (or typical…) engagement rate, then that cannot explain the decline in impressions. Given Dr No has just over 200 followers, and the whole point of following is to get to see the followed twitter account tweets, each tweet should gain at least 200 impressions (recall an impression just means twitter has served up the tweet, not that it has necessarily been seen or engaged with). Initially this was indeed the case. Looking at the chart again (and ignore the three high impression outliers), we can see that up to about tweet 9 or 10, there were around 500-600 impressions per tweet, with a possible gentle increase. After tweet number 10, things went into a decline, reaching less than 100 impressions by tweet 29, and have stayed that way ever since.
Now, the key thing about impressions is that they are, with the exception of inclusions in search results, which are likely to be trivial, exclusively controlled and counted by twitter. To recap, the official twitter definition of an impression is ‘Impressions: Times a user is served a Tweet in timeline or search results’. This means that the only thing that controls impression numbers is twitter itself, either through some machine code or algorithm, or through human intervention. Given stable follower numbers, and consistently better than typical engagement rates, it seems most unlikely that an algorithm would downgrade Dr No’s tweets, and afford them lower impression numbers, on the grounds of poor content. That only leaves the content itself. Something — Dr No cannot for a moment imagine what it might be — about Dr No’s tweets is disagreeable to twitter, and as a result it is cutting back on tweet impressions for Dr No. Or, to put it more bluntly, the inescapable though reluctantly gained conclusion is that twitter is censoring Dr No’s tweets.